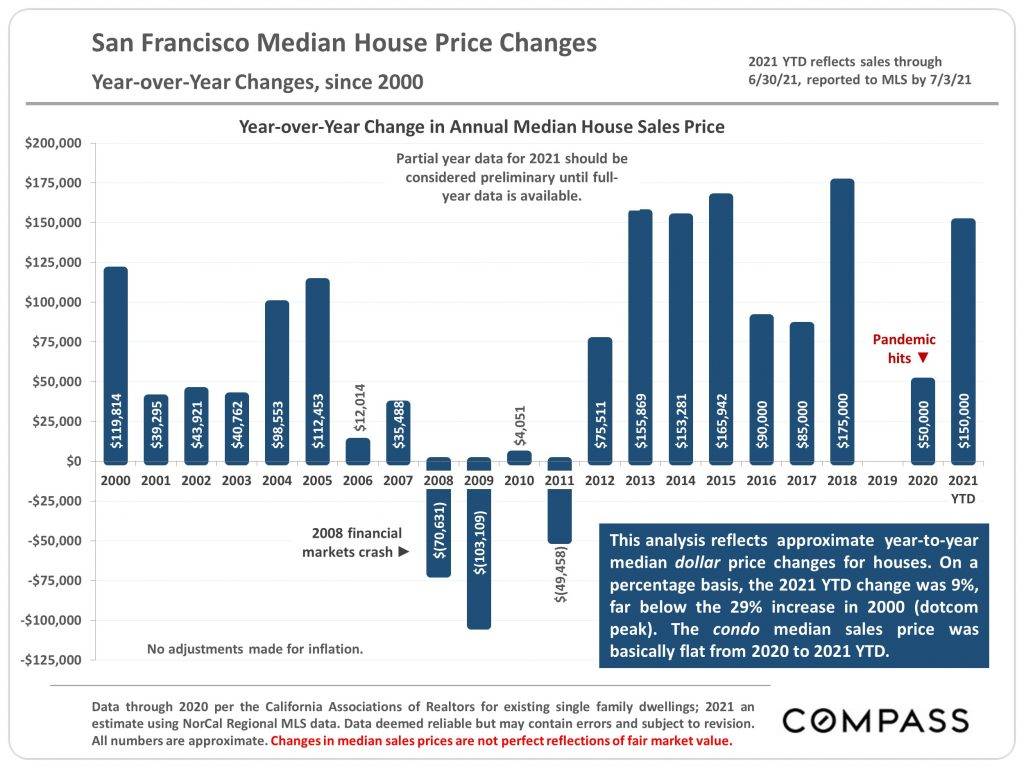
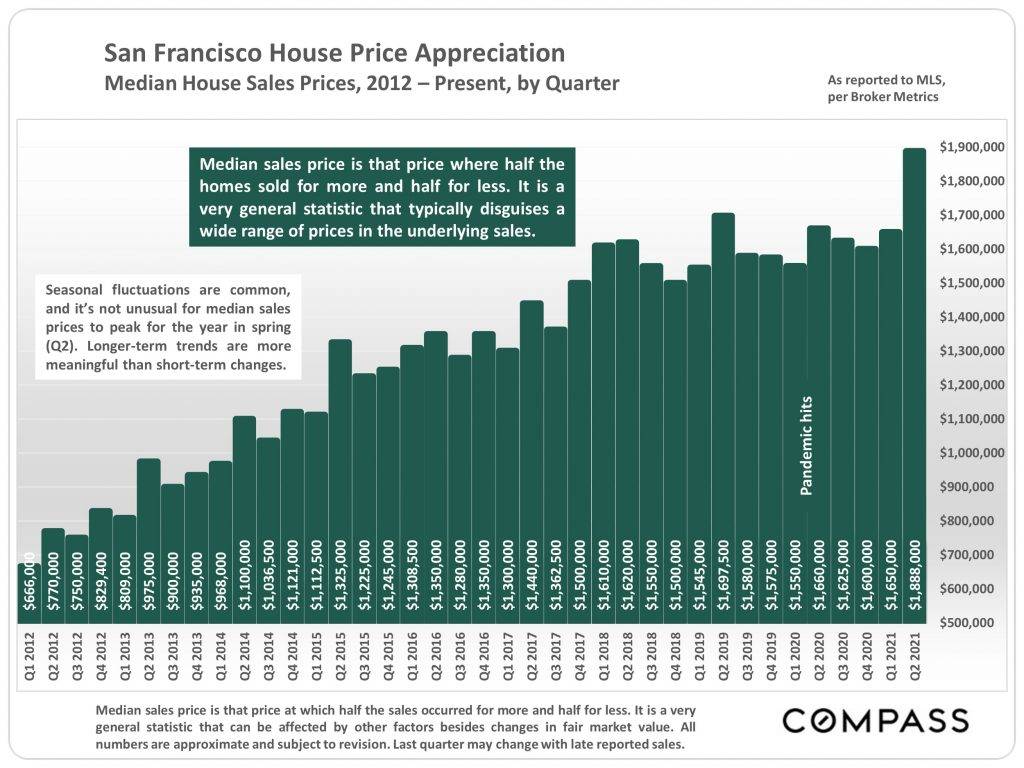
SF real estate in July 2021 is "back on track" after 2020's upheaval. Median sales price for single-family homes is up $150,000 year-to-date, a similar increase as 4 of the last 8 years.
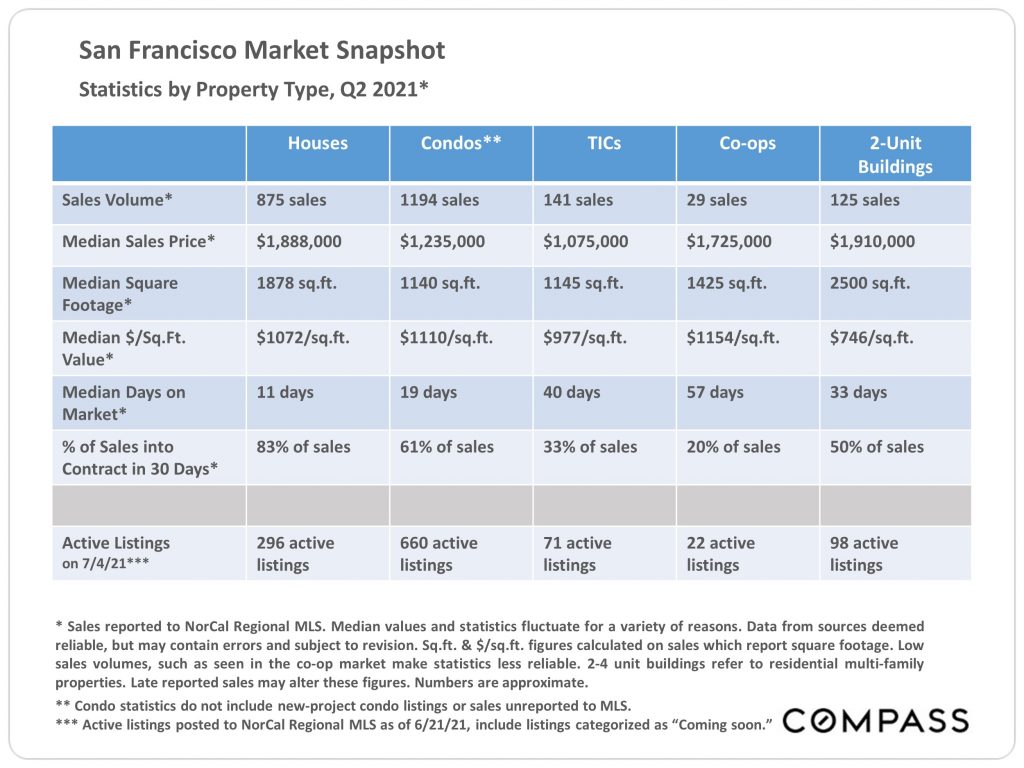
This San Francisco real estate snapshot provides an overview of key market statistics in Q2 2021: number of sales, pricing, and the speed of sale.
Sales prices among single-family homes saw a minor bump in early 2021. However, Q2 of 2021 saw one of the most significant increases in median sale price of any quarter in years, as the city became increasingly open.
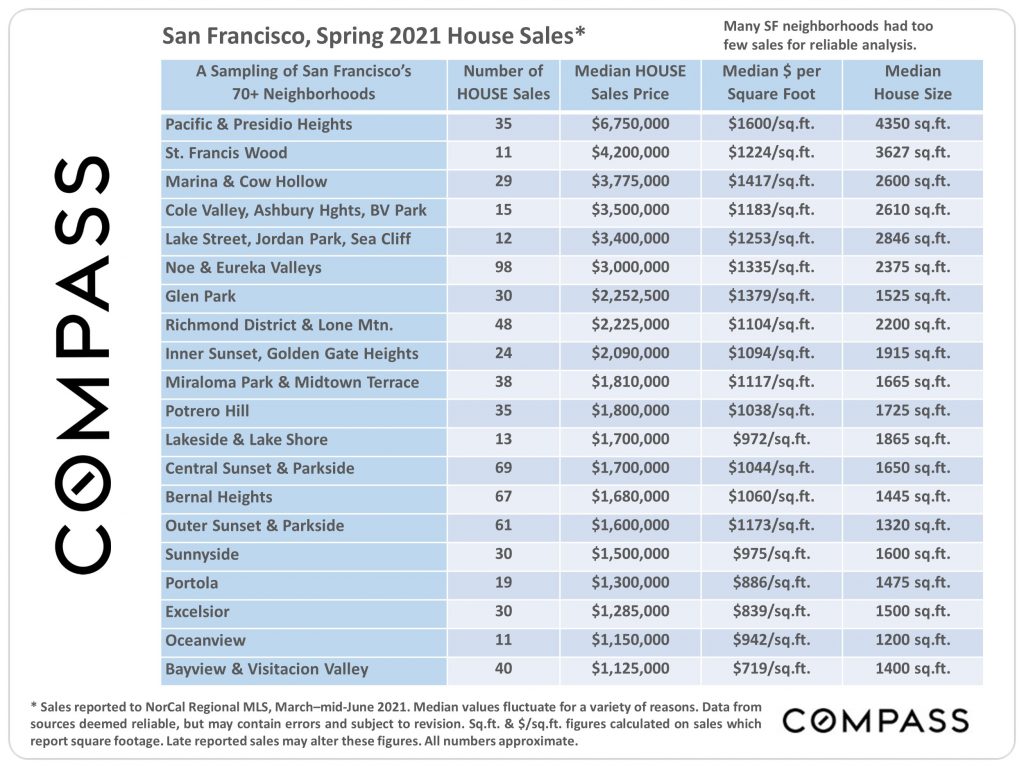
Some neighborhoods have too few sales to provide reliable analysis. What we do know is that sales among the high-end luxury single-family homes ($3M+) have continued at a historic rate.
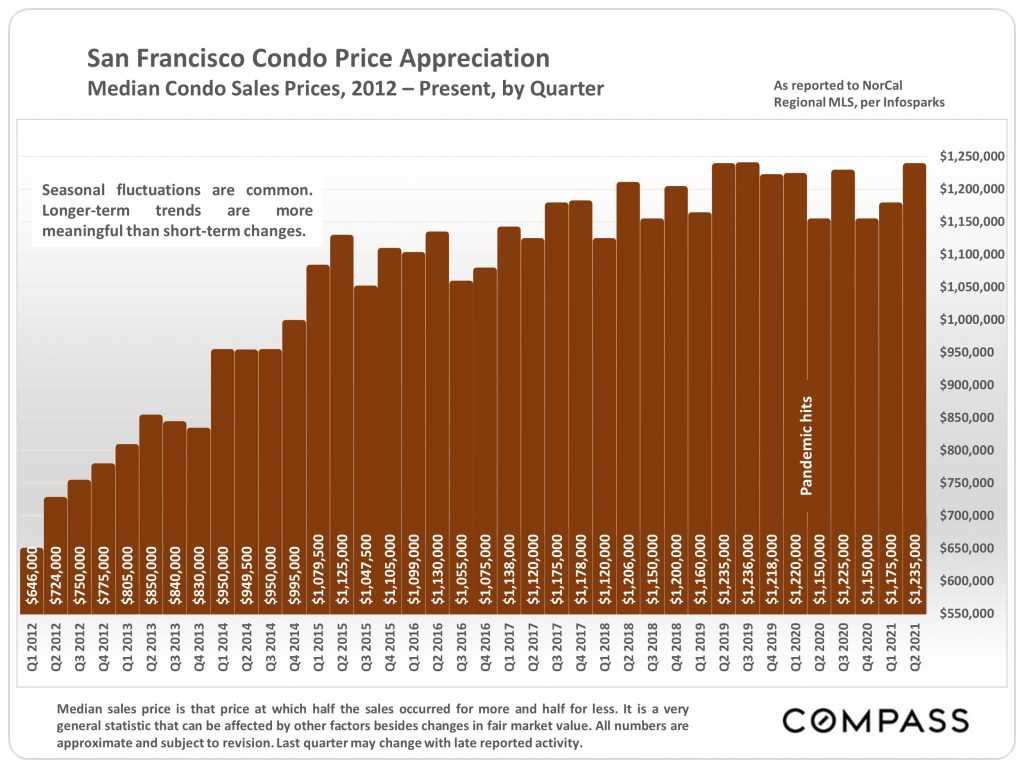
Sales prices among San Francisco condos are finding a new equilibrium — and increasing — after buyers steadily chipped away at mountains of pandemic-driven listing inventory.
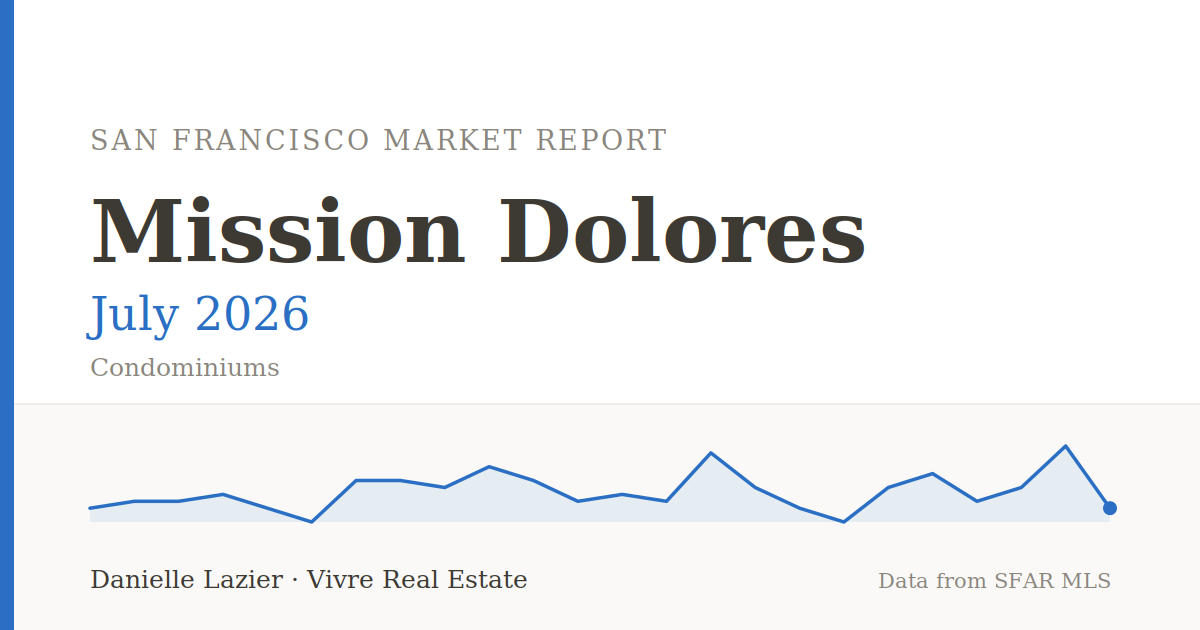
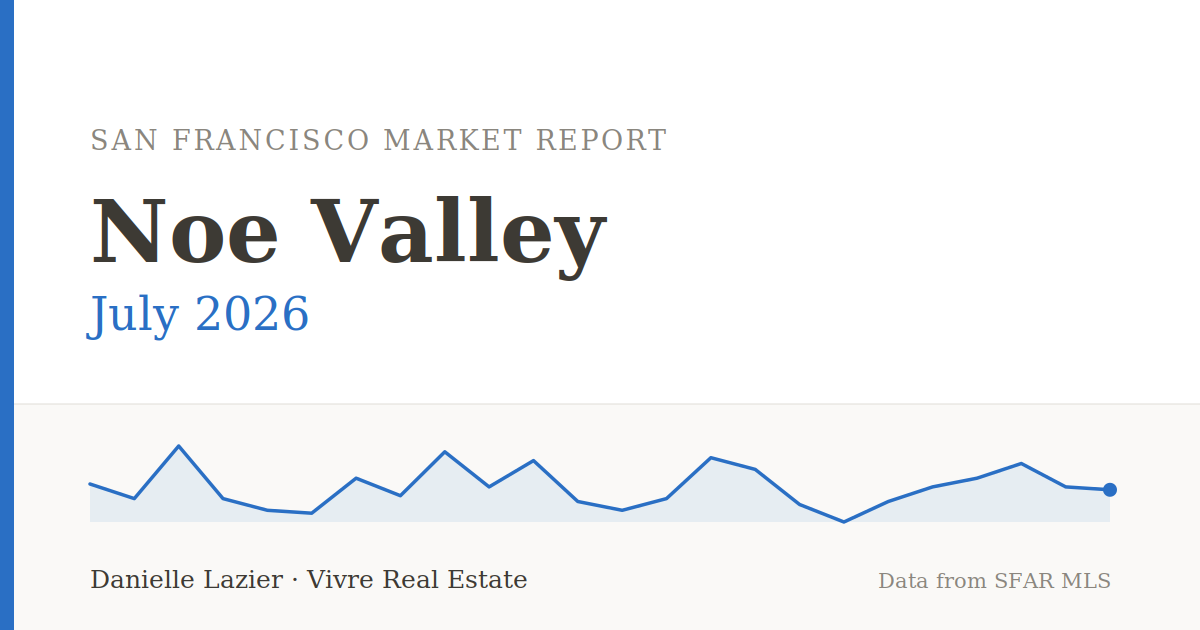
From luxury condos in Pacific Heights to contemporary South Beach lofts, to Noe Valley Victorian flats, sales have been brisk among standard 2-bed, 2-bath condos.
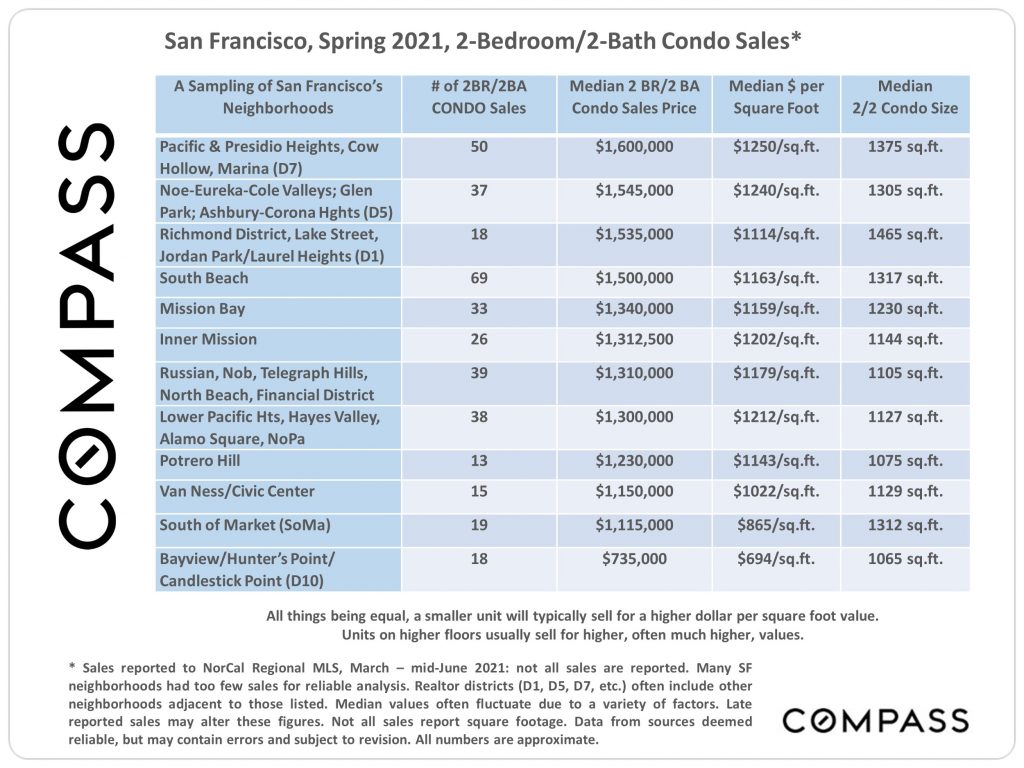
Despite the dramatic, historic rise in luxury home sales (houses $3M+, condos $2M+), the bread and butter of SF's housing market are still in the $500,000–$2M range, which comprised three-quarters of sales in the past 6 months.
Report issued on June 24, 2021, by the Office of the Controller & the Office of Economic Analysis of the City & County of San Francisco; Lead authors Ted Egan, Ph.D., Chief Economist, & Asim Khan, Ph.D., Senior Economist
Click here to view and download the full report.
These excerpts were compiled and edited in good faith but may contain errors and are subject to revision. Readers are encouraged to review the complete report, which also includes other statistics and insights.
Among both single-family homes and condos, new listings were significantly higher this spring than in spring of 2019, before the pandemic.
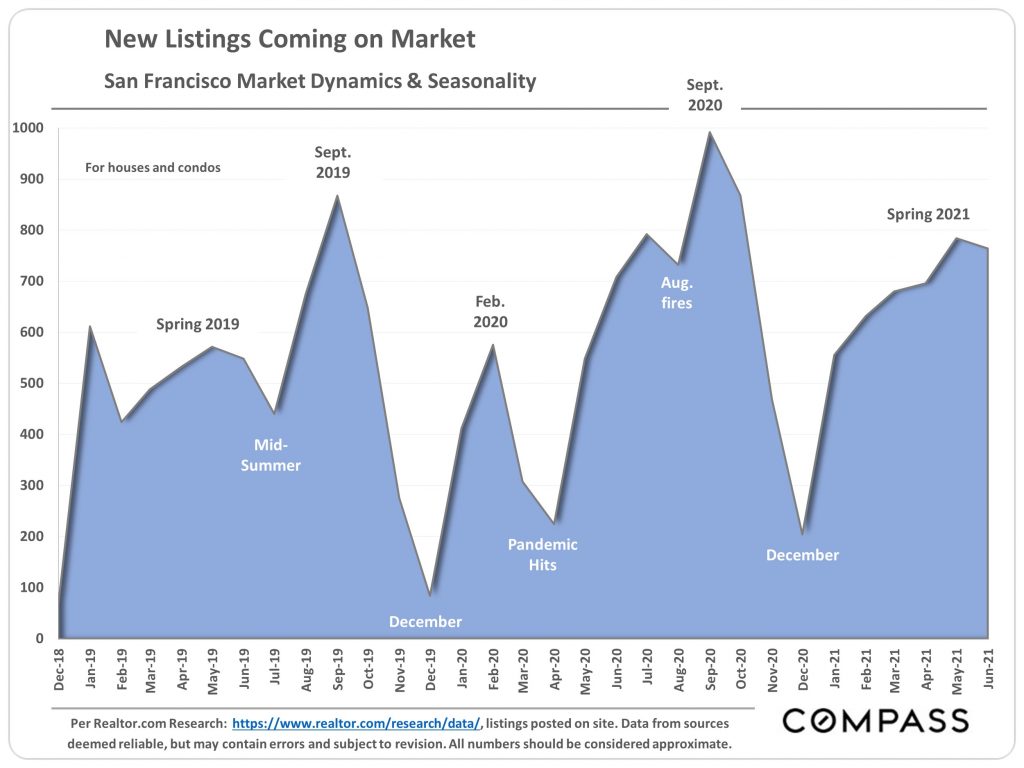
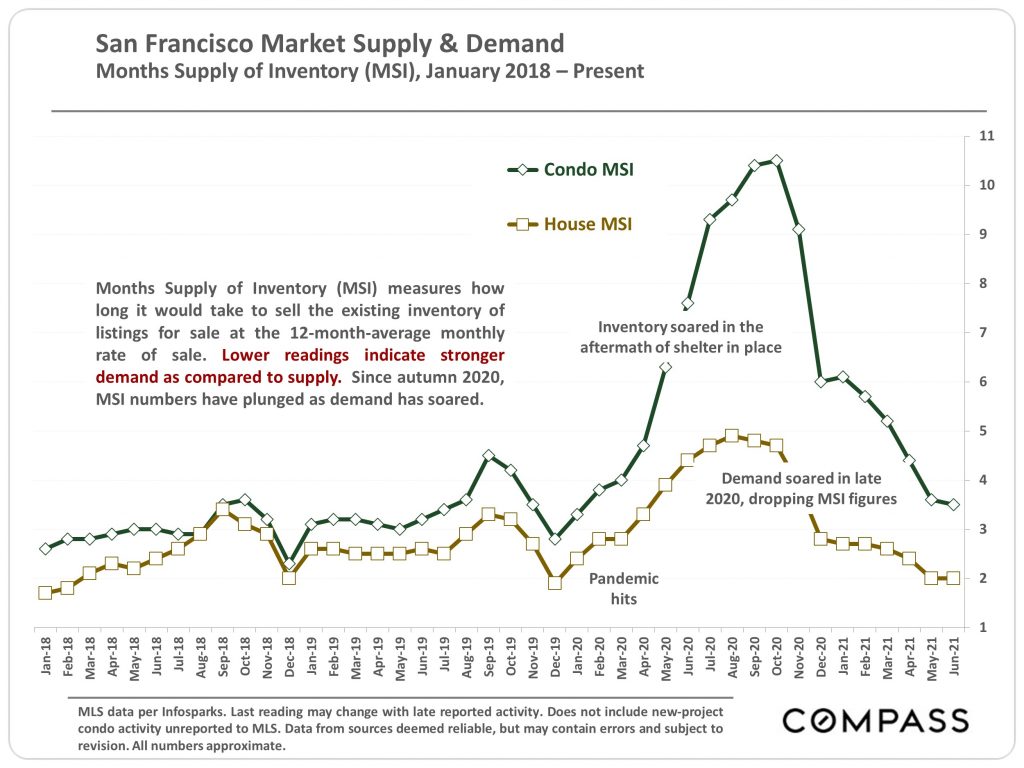
Pandemic-driven peaks in listing inventory were largely gobbled up in a very busy spring season. However, the amount of available listings was still unseasonably high by the close of spring 2021, compared with recent years.
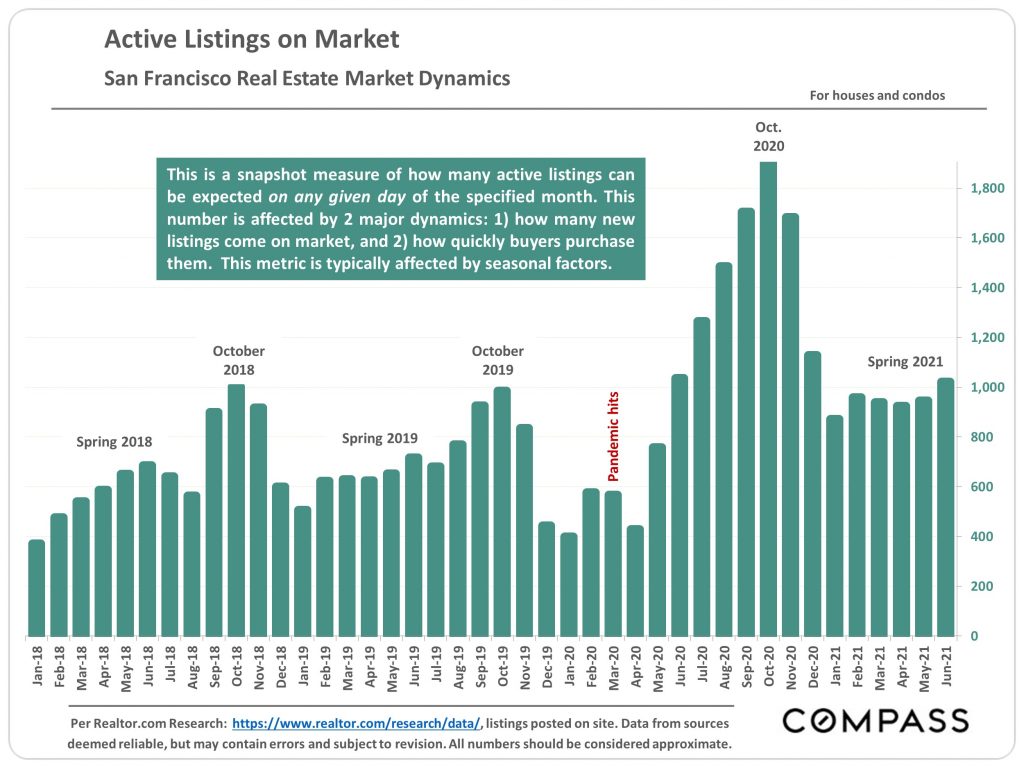
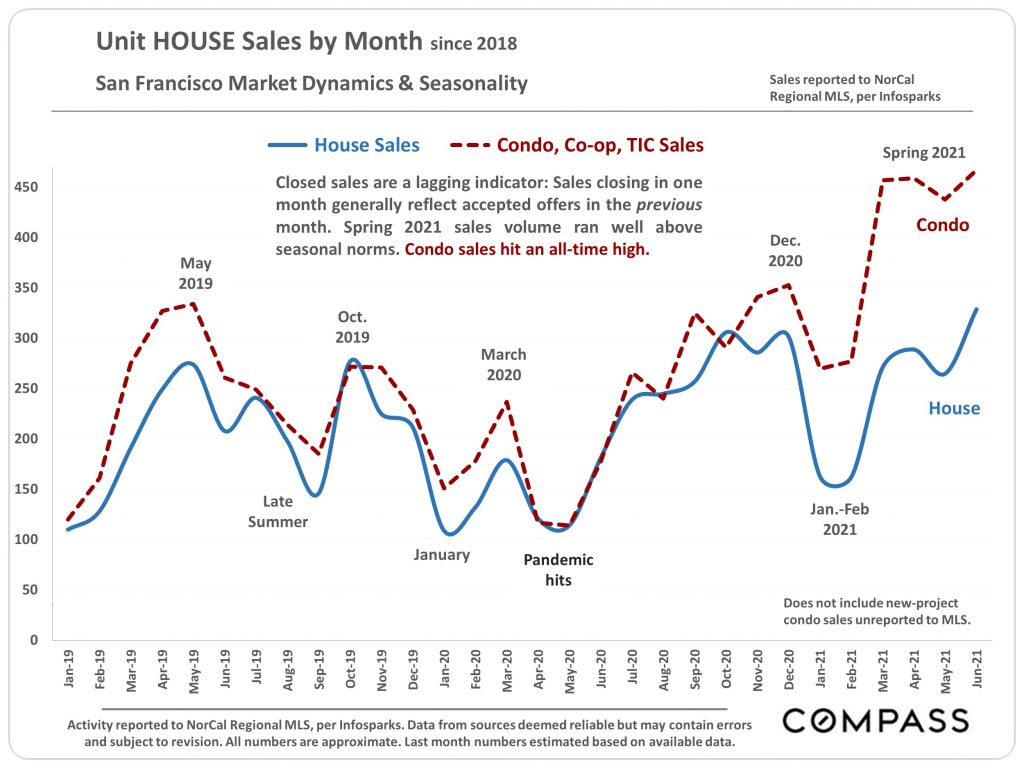
Seasonality is a big part of real estate markets, and it remains a factor even in these unusual times. After peaking in March-May, sales began to slow in June. If history is a guide, the market will pick back up in autumn.

Condo sales hit an all-time high in the spring of 2021, with eager buyers pouncing on abundant inventory. Single-family home sales were no slouch either, but they were hampered by lower inventory to begin with.
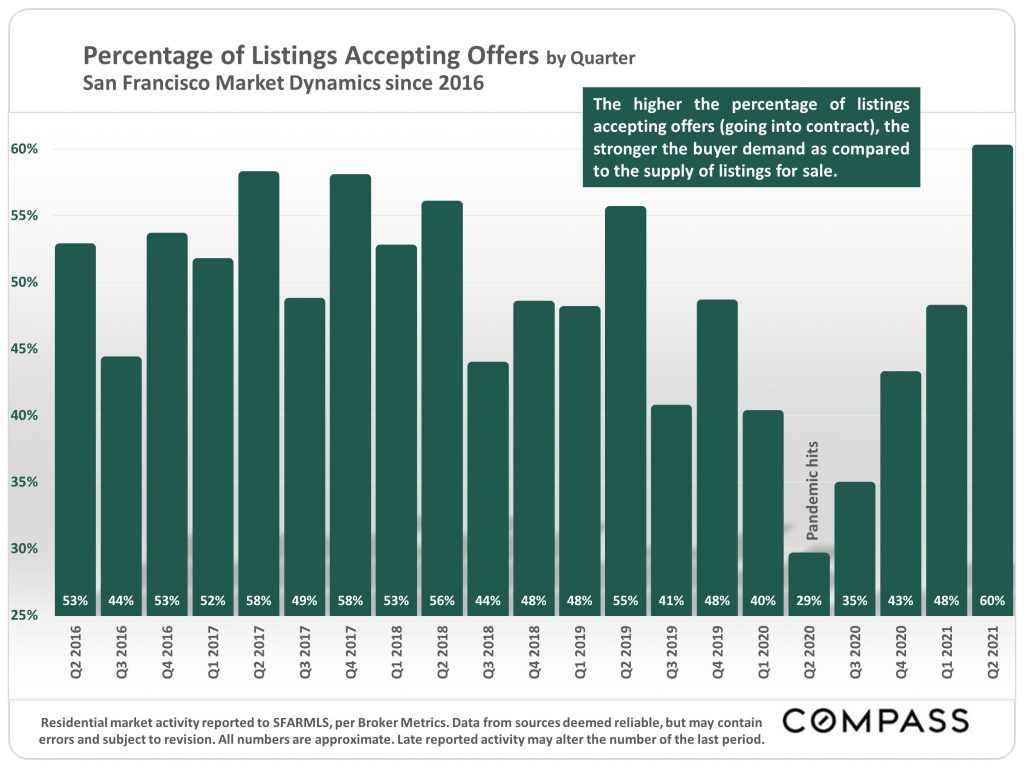
At 60%, the ratio of listings accepting offers in Q2 2021 was the highest in years. This illustrates a strong resurgence in buyer demand, as competition heats up and sellers receive more attractive offers.
Last year, this mountain of condo inventory (and even a bump among single-family homes) was startling. But as fast as it came, it went in a flurry of winter and spring home sales.
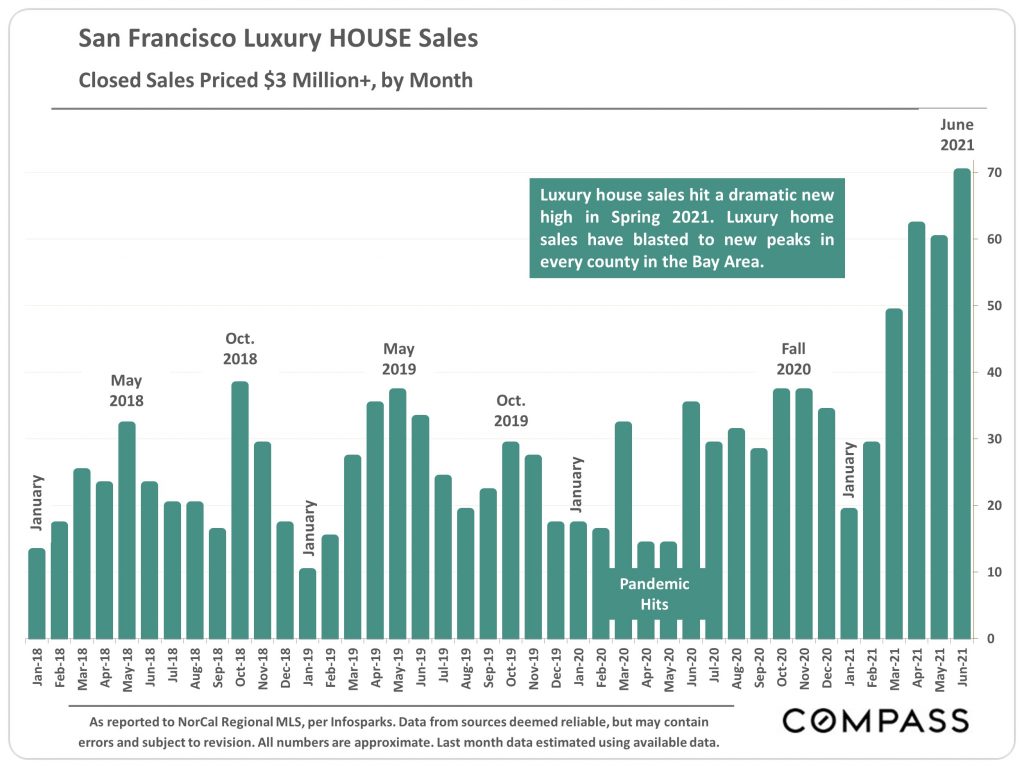
In addition to listing inventory, another incredible statistic has been in luxury real estate sales. Luxury single-family homes ($3M+) vaulted to new heights in early 2021 and, so far, have kept on climbing.
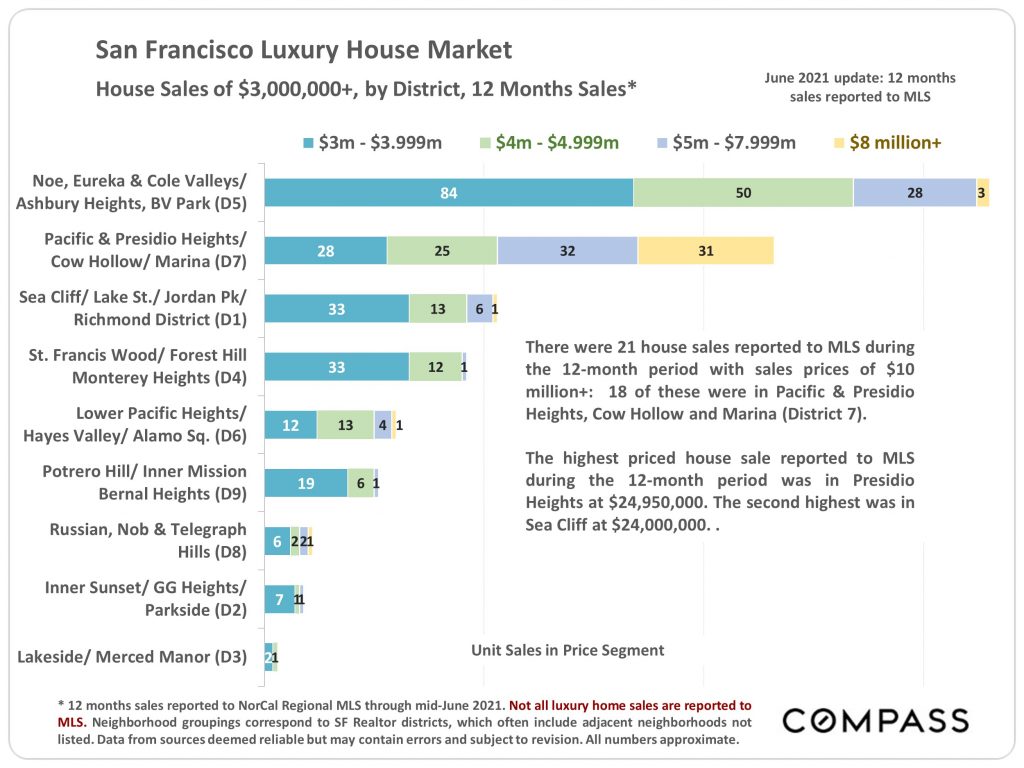
San Francisco's District 5 — Noe, Eureka, and Cole Valleys, Ashbury Heights, and Buena Vista Park — saw the greatest number of luxury single-family sales in the past 12 months, mainly led by the lower end of the luxury spectrum ($3M-5M). On the higher end, District 7 had by far the most sales over $8M.
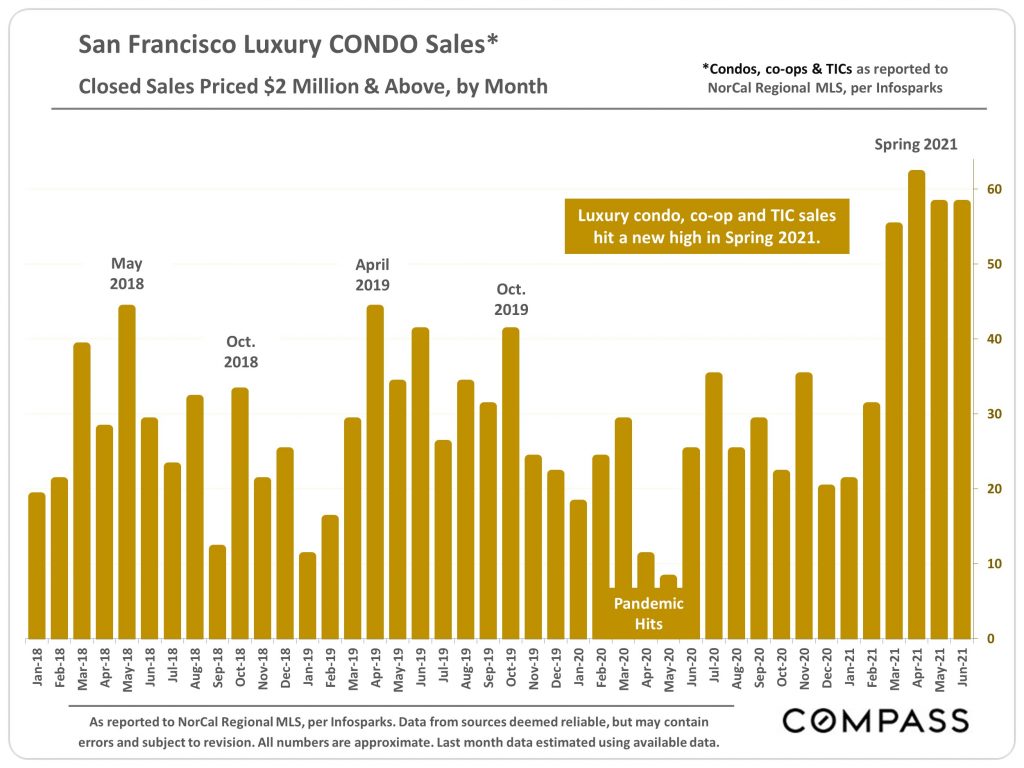
Sales of San Francisco luxury condos ($2M+) also hit a new high this spring, with nearly 60 sold in every month since March. Previously, it was rare to break 40 luxury condo sales in a month.
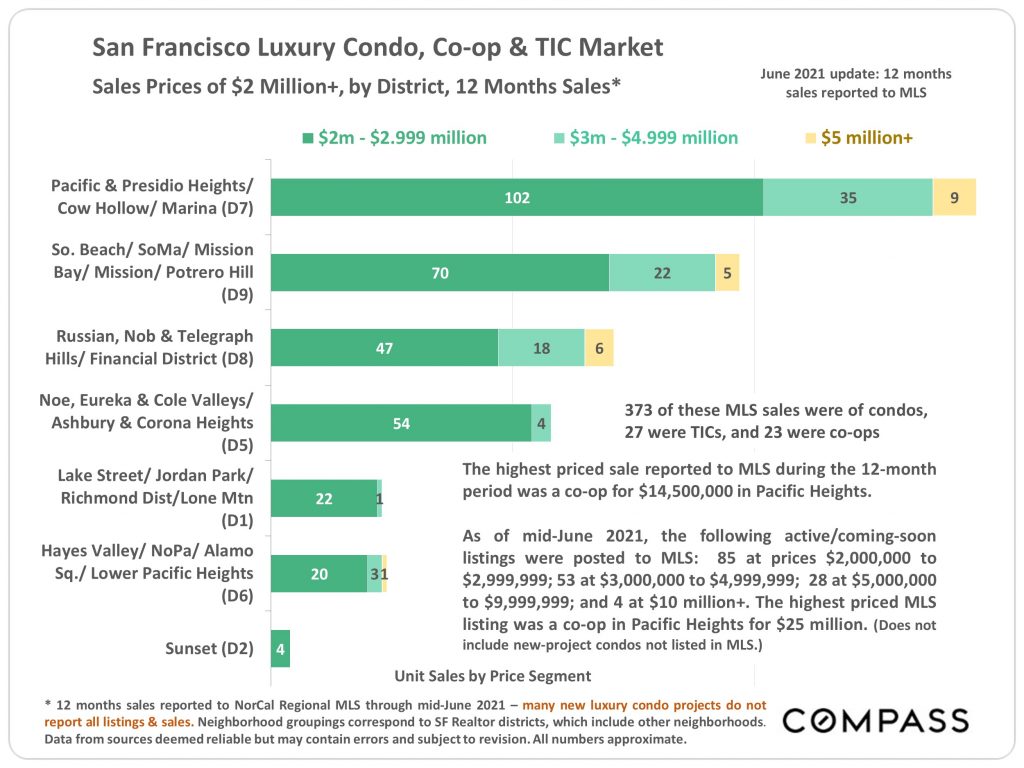
San Francisco's District 7 took the crown for the highest number of luxury condos/co-ops/TICs sold in the last 12 months. The highest-priced sale was also in District 7 (Pacific Heights) at $14.5M.
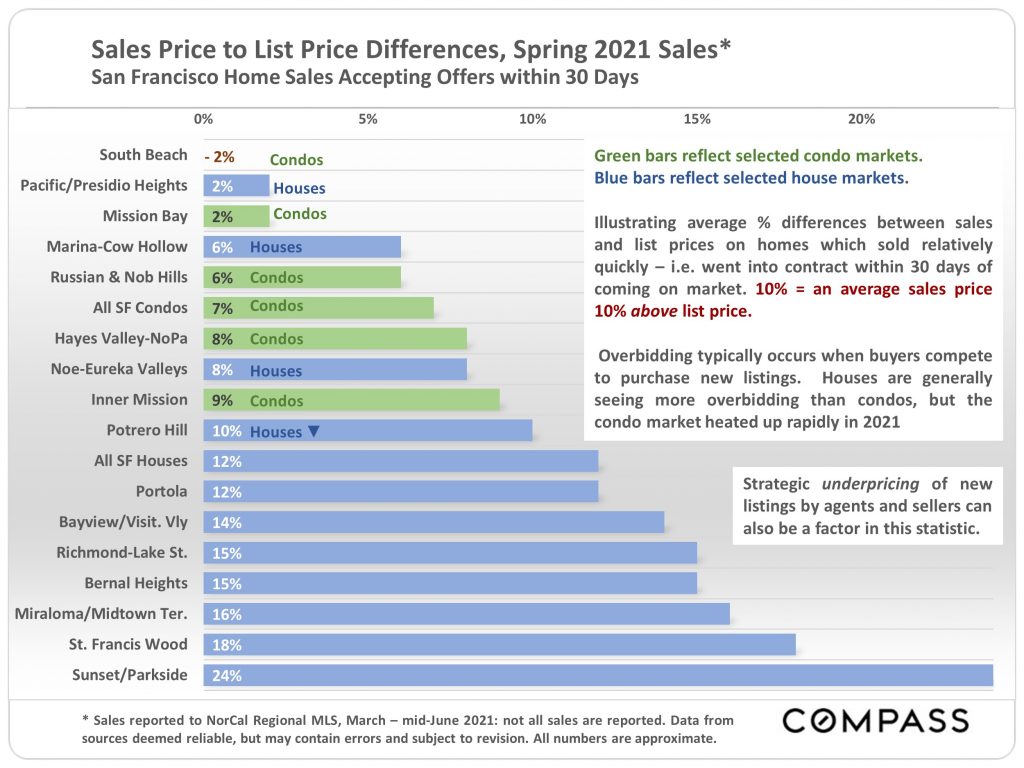
Overbidding is clearly more prevalent among single-family homes than in condos. But after building such an enormous glut of inventory in 2020, it's perhaps more striking that overbidding is occurring in condos at all — a strong sign of demand outpacing supply.
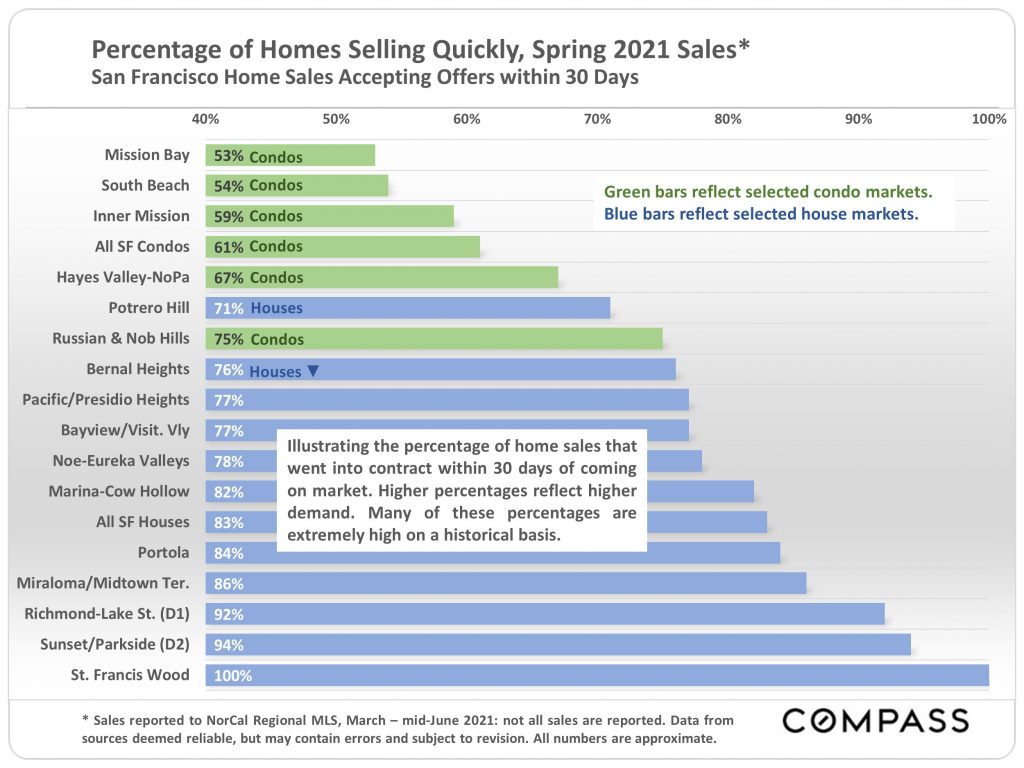
Another sign of increasing competition among buyers is how quickly listings are sold. In the spring of 2021, a sizable majority of both single-family homes AND condos city-wide were sold within 30 days of hitting the market.
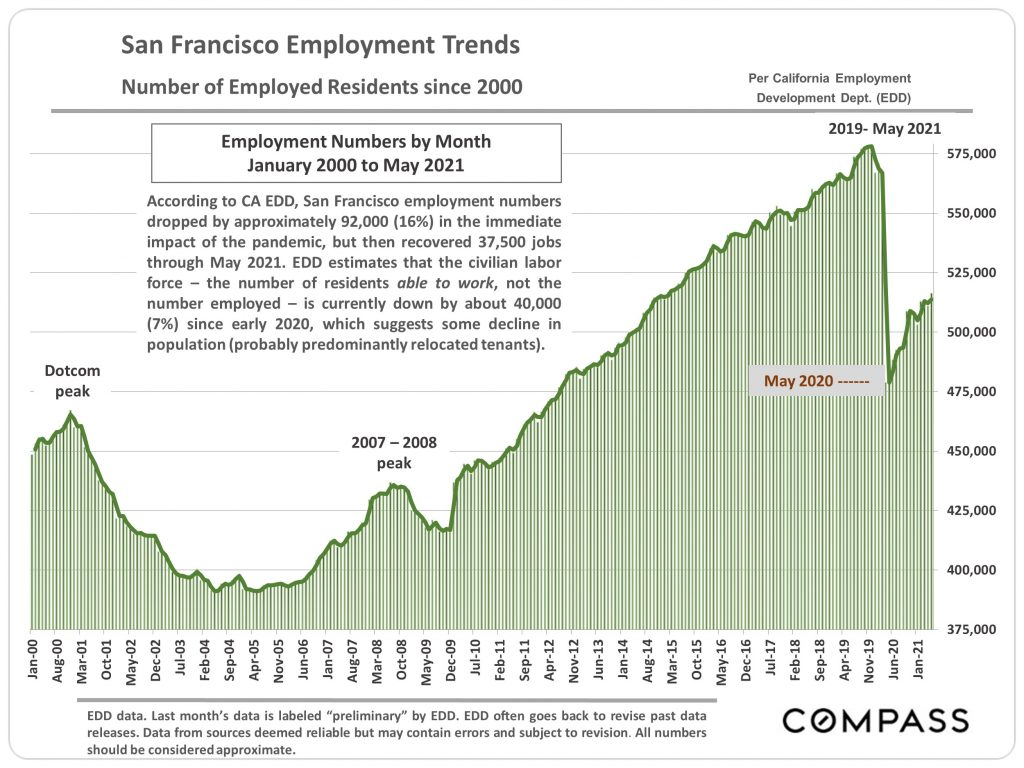
Employment numbers dropped sharply when the pandemic hit. But of ~92,000 jobs lost or left, ~37,500 have been recovered, and ~40,000 more were previously filled by former SF renters who have likely since relocated.
We hope this July real estate market update for San Francisco will help you in planning your real estate future.
If you have questions about the market or your next steps to buying or selling, let us know! We’re always happy to help you and anyone you send our way.
If you are thinking of selling your San Francisco property, fill out our Seller Worksheet to tell us more about your situation. If you’re looking to buy a home in San Francisco, tell us your goals and timeframe in our Buyer Worksheet. Or send us a message with any general inquiries. Have a great day!
Want to stay up to date on San Francisco real estate?
Sign up for our twice-monthly email newsletter to get information and insights delivered straight to your inbox.
Oh, and we don't share or sell your information, period. (We hate spam too.)
(Footnote disclaimer: Statistics are generalities, essentially summaries of disparate data generated by dozens, hundreds or thousands of unique, individual sales. They are best seen not as precise measurements, but as broad, comparative indicators, with reasonable margins of error. Anomalous fluctuations in statistics are not uncommon, especially in smaller markets with fewer sales. Data from sources deemed reliable, but may contain errors and subject to revision. All numbers are approximate.)