As this historic year comes to a close, we’re looking back with a year-end review of the 2020 San Francisco real estate market. Through politics, protests, and of course a pandemic, San Francisco real estate was affected in many unexpected ways this year. The best projections of real estate economists were quickly turned on their heads. So, where did we end up? What did happen in San Francisco’s 2020 real estate market?
Before we begin, I should note that those of us in real estate have been lucky compared to so many others. When the state government deemed real estate an essential industry, it was a clarion call for agents, escrow and title officers, photographers, stagers, and other real estate pros that our work could go on while following proper safety protocols. We learned, adapted, and ultimately helped our clients to navigate the market and find results. For that, I am grateful.
Over Troubled Waters
That’s not to say it’s all been smooth sailing. Amid the first shelter-in-place orders, before guidance came down from public health authorities in Sacramento, I thought I might never sell a home again. Thankfully, I was wrong.
Then came the stories of an “exodus from San Francisco,” as pundits all around the country pondered the seemingly inevitable demise of our city’s high-valued, tech-powered real estate market. Twitter started a cascade of big tech companies allowing employees to work from home in perpetuity, and conventional wisdom was that those employees would therefore have no reason to stay in San Francisco. Now ten months into the pandemic, it’s clear that those sullen real estate obituaries were true to a limited extent — particularly in the condo market, as we’ll explore in the full San Francisco real estate market review below — but widespread gloom and doom has largely been avoided.
Adapt / Overcome
What did occur this year was a whole lot of adaptation, from the way we do business to the way we shop, dine, and interact with each other. In real estate, homebuyers have shifted to touring properties virtually before requesting an in-person showing. Zoom rooms have replaced the living room or local cafe for meetings and interviews. Home offices are the hot new commodity atop most homebuyer wishlists. These trends will certainly continue into 2021, and maybe forever. I covered it all in my recent virtual workshop, 2021 Real Estate Preview: Design, Marketing, Market Crystal Ball, Tax FAQ & Prop 19.
On the whole, the San Francisco real estate market stayed remarkably strong throughout an otherwise fraught year. Home values have appreciated 251% in the past 20 years, and that general trend has continued even during the pandemic: the average home sale closed 1.4% higher in November 2020 than in November 2019. In the long-term, San Francisco real estate has been and will likely continue to be a solid investment. In the short- and medium-term, however, some types of properties are struggling.
Divergent Outcomes
As you read our San Francisco real estate market analysis, you’ll notice that areas with lots of quintessentially San Francisco Victorian and Edwardian single-family homes fared quite well in 2020, while areas with many smaller condos fared worse. Homebuyers desire for more interior and exterior space in their new home is reflected in better results for single-family homes across most metrics when compared with condos.
With all that said, let’s see what really went down this year in the San Francisco real estate market!
What Happened in the 2020 San Francisco Real Estate Market
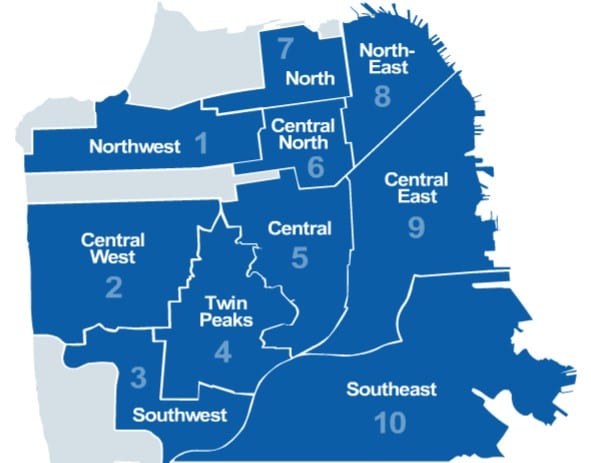
San Francisco MLS Districts 1-10 | Area map by San Francisco Assoc. of Realtors®
In lieu of final numbers for December, our analysis covers 2020 year-to-date up to November. December is typically slower due to the holidays, so November is a logical cutoff in any case. If you were unaware, San Francisco is organized into ten Districts. We’ll dig into the results for each one, starting with…
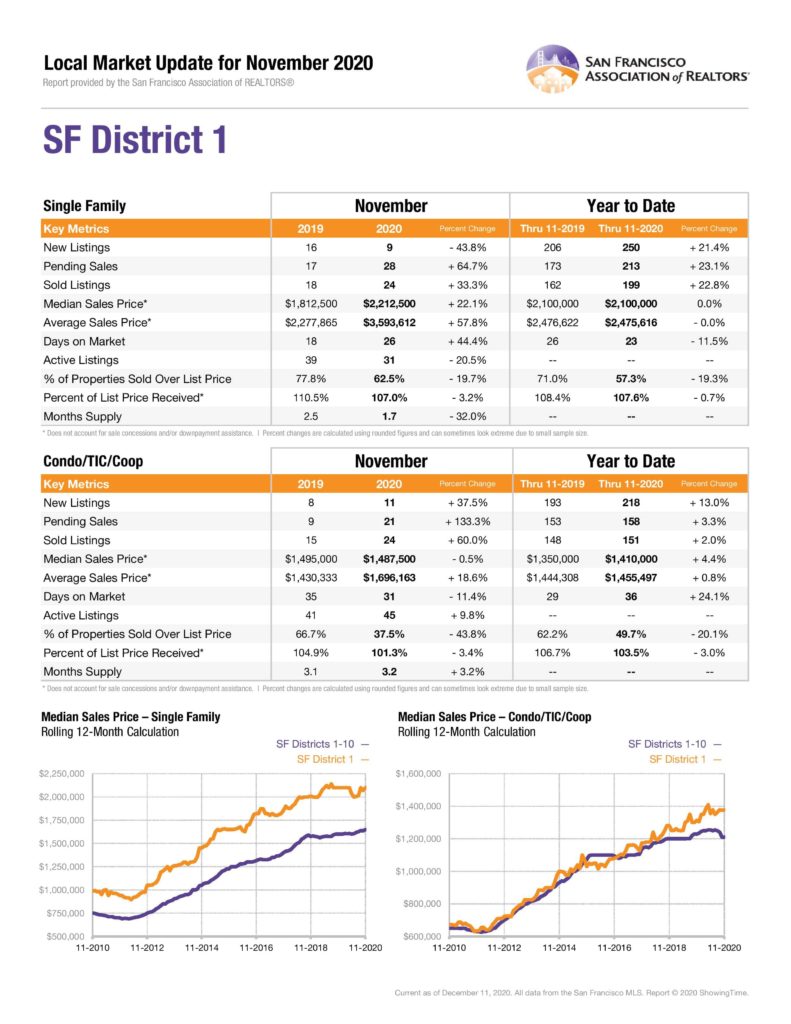
District 1: Northwest (The Richmond)
Sea Cliff, Lake Street, Richmond, Jordan Park, Laurel Heights, Lone Mountain
2020 data provided by SFAR/InfoSparks
Single-family Homes in District 1, 2020
Huge increase in listings across the board: new, pending, and sold. Over a 20% increase in each statistic year-over-year.
Prices remained flat, with no change to average or median sales price year-over-year.
Despite the increase in new listings, properties averaged less time on the market before being sold (23 days) compared to 2019 (26 days).
Less homes sold for over their list price, a 19% drop from 2019. This reflects a changing trend towards more market-accurate, “buy it now” list prices by sellers who want to quickly close their deal.
Condos in District 1, 2020
Small increases in new, pending, and sold listings.
A small jump in median (+4.4%) and average (+0.8%) sale prices.
Sold condos spent considerably longer on the market, up by 24% to 36 days in 2020 from 29 days in 2019.
Large drop in condos sold above list price, down 20% to just under half in 2020.
Despite spending more time on the market and fewer selling above the list price, the higher-end condos of District 1 fared much better than some other areas of SF.
District 2: Central West (Sunset)
Sunset, Parkside, Golden Gate Heights
2020 data provided by SFAR/InfoSparks
Single-family Homes in District 2, 2020
New, pending, and sold listings were down across the board in 2020, but not by much.
Median and average sales prices were essentially flat.
Days on the market stayed flat as well, increasing from 21 days in 2019 to 22 days in 2020.
Fewer homes sold above list price, down 12% from 2019 to a still-impressive 75% in 2020.
Sales-to-list price ratios were slightly lower, but still well above 100%.
Condos in District 2, 2020
Significantly more condos were newly listed, pending, and sold compared to 2019 — nearly a quarter more across the board.
Median sales prices were flat, a decent outcome compared with condos in some other districts.
Condos spent slightly longer on-market compared to 2019, up 3 days or 11.5% to 29 days on average.
Far fewer condos sold above list price, down 40% from 2019. Again, this reflects a buy-it-now mentality from sellers, buyers, and their agent advisers.
District 3: Southwest (OMI)
Lake Shore, Lakeside, Merced Manor, Merced Heights, Ingleside, Ingleside Heights, Oceanview
2020 data provided by SFAR/InfoSparks
Single-family Homes in District 3, 2020
No big changes to new, pending, or sold listings in 2020, but new listings were up slightly while pending and sold were down. This is reflected in an 8.3% increase in time spent on-market, up to 26 days from 24 days in 2019.
Median sales price increased 5% year-over-year.
The ratio of listings that sold above the list price and their sales-to-list price both decreased, by about 20% and 6% respectively.
Condos in District 3, 2020
District 3 had the lowest number of condo sales of any District, and prices are on the lower end of the spectrum.
New condo listings increased by 7%, but pending and closed sales decreased considerably (27% fewer pending, 18% fewer sold).
With only 27 closed condo sales in the District this year, some of the ~6% drop in median sale price may be attributed to a small sample size. But increased supply and reduced demand are the bigger culprits.
Interestingly, despite a drop in total sales and median sales price, condos averaged 4 fewer days of the market this year.
The ratio of condos sold above list price fell by more than half, down to 22.2% from 51.5% in 2019.
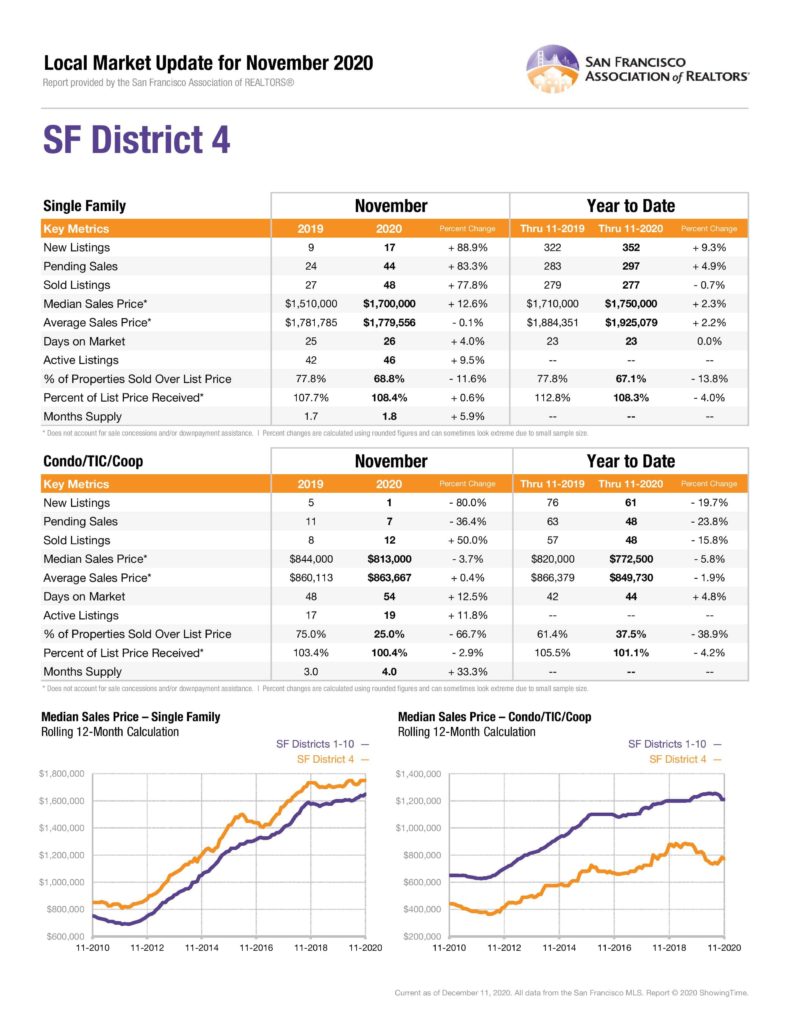
District 4: Twin Peaks West
St. Francis Wood, Forest Hill, West Portal, Forest Knolls, Diamond Heights, Midtown Terrace, Miraloma Park, Sunnyside, Balboa Terrace, Ingleside Terrace, Mt. Davidson Manor, Sherwood Forest, Monterey Heights, Westwood Highlands
2020 data provided by SFAR/InfoSparks
Single-family Homes in District 4, 2020
More new listings, more pending sales, and about the same closed sales compared with 2019.
The median sale price inched up slightly, up $40,000 or 2.3% to $1,750,000 in 2020.
Days on the market stayed flat at 23 days in 2019 and 2020.
The ratio of sales that closed at the above list price fell in District 4 as well, down about 14% compared to 2019. Noticing a trend?
Condos in District 4, 2020
Basically, every statistic was negative to some degree for District 4 condos in 2020.
New listings were down nearly 20%, pending sales were down nearly 24%, and closed sales were down nearly 16%.
Median sales price fell by 5.8% this year, down to $772,500 from $820,000 in 2019. Again, this could be in part due to a smaller sample size (only 48 sold condos this year), but it’s mostly supply and demand.
District 4 condos spent longer on the market, up by 5% to 44 days, from 42 in 2019.
The ratio of properties sold over the list price fell by 39%.
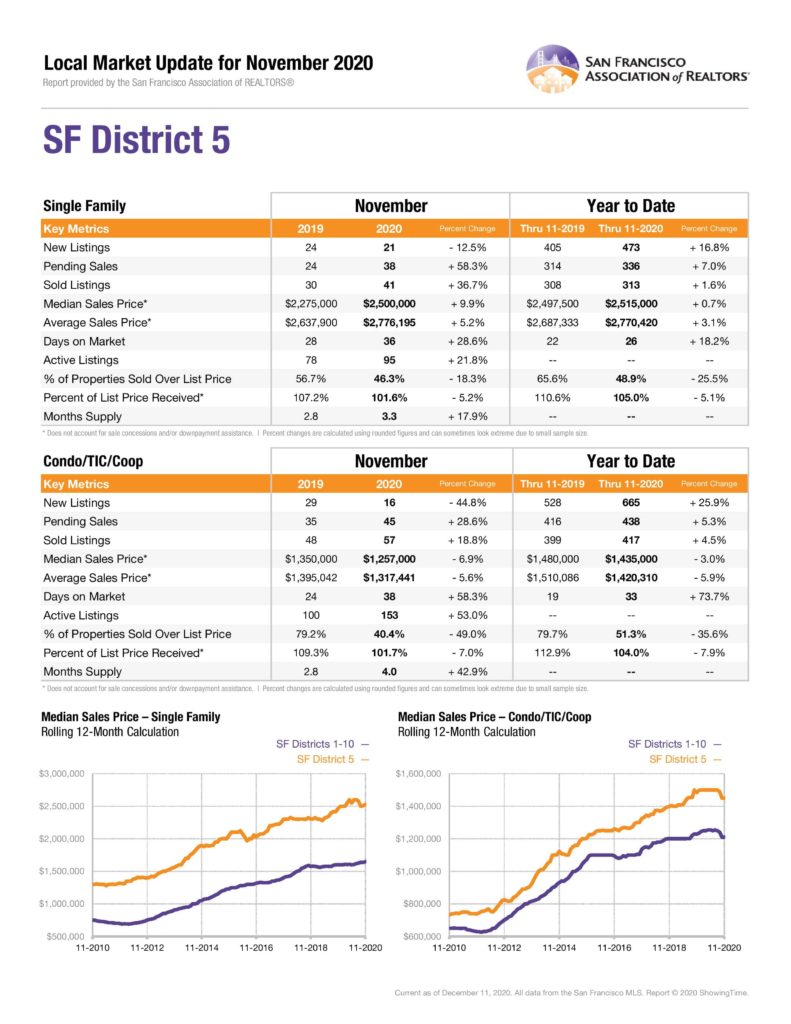
District 5: Central
Glen Park, Haight Ashbury, Noe Valley, Twin Peaks, Cole Valley/Parnassus Heights, Buena Vista/Ashbury Heights, Corona Heights, Clarendon Heights, Duboce Triangle, Eureka Valley/Dolores Heights, Mission Dolores
2020 data provided by SFAR/InfoSparks
Single-family homes in District 5, 2020
Listings increased across the board, with new listings up 16.8%, pending up 7%, and sold up 1.6%.
The median sale price increased slightly (+0.7%), from $2.497MM to $2.515MM.
Listings spent longer on the market, however, up 18.2% to 26 days from 22 days in 2019.
The ratio of homes that sold over list price fell by 25.5%, a large decrease but still roughly half.
The average sales-to-list ratio price fell by 5.1%, down to 105%.
Condos in District 5, 2020
New listings sharply increased, up 25.9% from 2019. Pending and sold listings increased but less so, up about 5% each.
Median sale price fell $45,000 year-over-year, down by 3% to $1.435MM.
The big increase in new listings led to an abundance in condo supply and a whopping 73.7% increase in days-on-market, up from 19 days in 2019 to 33 days in 2020.
The ratio of condos that sold above the list price fell by about a third to 51.3%.
District 6: Central North (Western Addition)
Anza Vista, Hayes Valley, Lower Pacific Heights, Western Addition, Alamo Square, North Panhandle
2020 data provided by SFAR/InfoSparks
Single-family Homes in District 6, 2020
District 6 has far fewer single-family homes than condos, but the small sample size included a 13% increase in new single-family listings (68), a huge 37.8% increase in pending sales (51), and a 25.7% increase in closed sales (44).
Median sale price for the District’s mostly high-end homes fell just a bit, down 2.2% to $2.835MM.
The average sold listing spent 37% more days on the market this year, up to 37 days from 27 in 2019.
One quarter fewer listings sold above list price, down to just 34% in 2020.
Single-family listings sold for roughly the same price as they were listed, at 101.3% on average.
Condos in District 6, 2020
District 6 this year saw an enormous increase in new condo listings, up 54.3% over 2019. Pending and sold listings also increased by 10.7% and 4.9% respectively.
Despite the massive increase in new listings year-over-year, prices did not fall by much: median condo sales price fell by 3.5% to about $1.2MM.
Also a surprise given the large increase in supply: the time spent on the market for the average District 6 condo jumped up by only one day or 3.2%, from 31 days in 2019 to 32 days in 2020.
The ratio of condos that sold above the list price fell by 27.6%, down to about half.
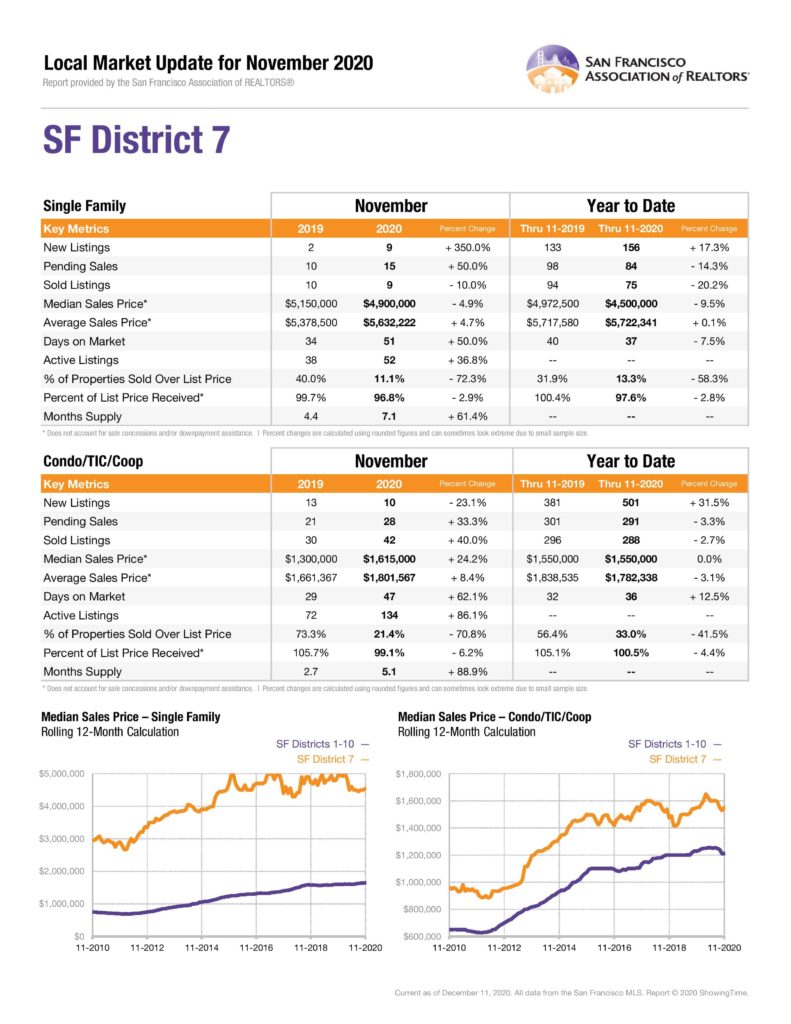
District 7: North
Marina, Pacific Heights, Presidio Heights, Cow Hollow
2020 data provided by SFAR/InfoSparks
Single-family Homes in District 7, 2020
Home to San Francisco’s highest-valued properties on average, District 7 includes many luxury properties which typically take longer to sell than the lower ends of the market. This year, however, listings in District 7 spent 3 fewer days on the market, down to 37 days from 40 days in 2019.
New single-family listings in District 7 increased by 17.3% this year while pending listings dropped 14.3% and sold listings fell 20.2%.
Because of increased supply, the median sale price in District 7 fell by nearly 10% in 2020, down from nearly $5MM in 2019 to $4.5MM in 2020.
Very few single-family homes sold for over list price in 2020, just 13.3%. This is significantly lower than any other District.
The percentage of list price received fell from 100.4% in 2019 to 97.6% in 2020.
Condos in District 7, 2020
New condo listings increased by 31.5% in 2020, while pending and closed sales each decreased by about 3%.
Despite higher supply, the median sales price remained perfectly flat at $1.55M in both 2019 and 2020.
Condo listings in District 7 spent 4 more days on the market compared to 2019, a 12.5% increase to 36 days on average.
The ratio of properties that sold above the list price fell by over 40% to one-third, and the average percent of list price received fell 4.4% to just above 100%.
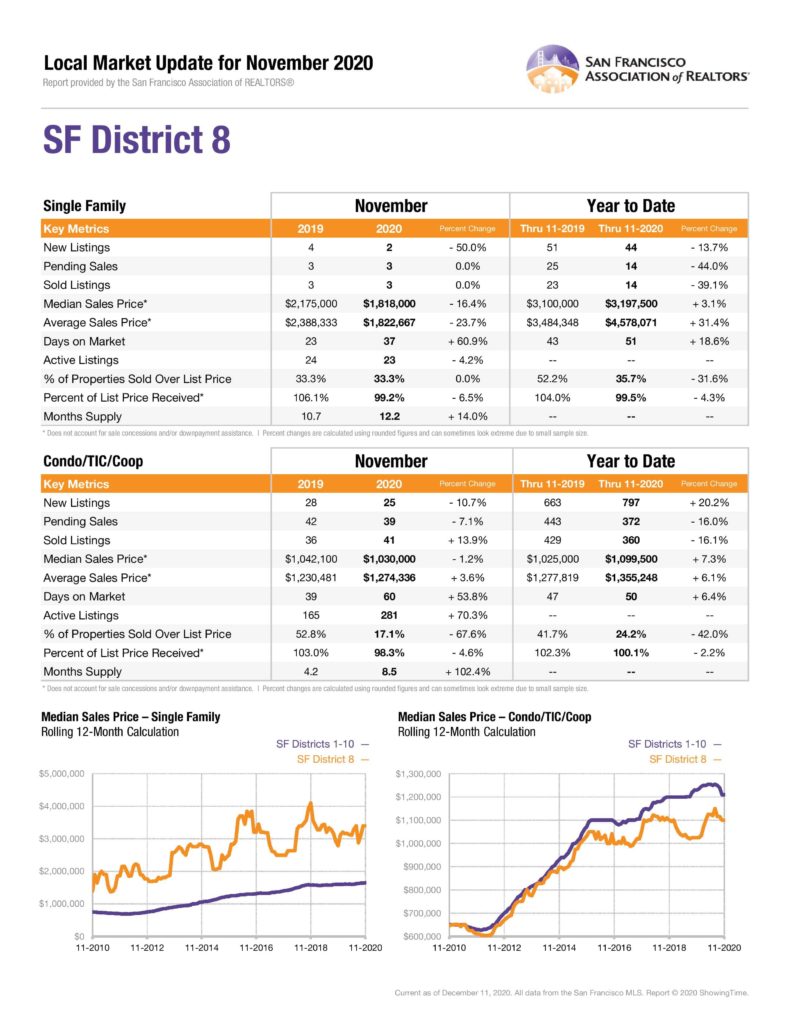
District 8: Northeast
Downtown, Financial District/Barbary Coast, Nob Hill, North Beach, Russian Hill, Van Ness/Civic Center, Telegraph Hill, North Waterfront, Tenderloin
2020 data provided by SFAR/InfoSparks
Single-family Homes in District 8, 2020
District 8 doesn’t have many single-family homes, but listing activity fell across the board in 2020: new listings fell 13.7%, pending sales fell 44%, and closed sales fell 39.1%.
Decreased activity did not mean decreased home values, however: the median single-family sales price in District 8 increased by 3.1% to nearly $3.2MM.
Days on the market jumped from 43 days in 2019 to 51 days in 2020, an increase of 18.6%.
Fewer homes sold above listing price in 2020, down to 35.7% from 52.2% in 2019.
The average percent of list price received fell by 4.3% to 99.5% in 2020.
Condos in District 8, 2020
New condo listings increased by over 20% while pending and sold listings each decreased by about 16%.
Condo listings average 3 more days on the market compared with 2019, up from 47 to 50 days.
Despite higher supply and more time on-market, the median sale price rose by 7.3% in 2020, an increase of about $75,000 to nearly $1.1MM.
The ratio of homes that sold above list price fell by 42%, down to about one-quarter of listings this year.
The average percent of list price received stayed relatively flat at just over 100%, a 2% decrease.
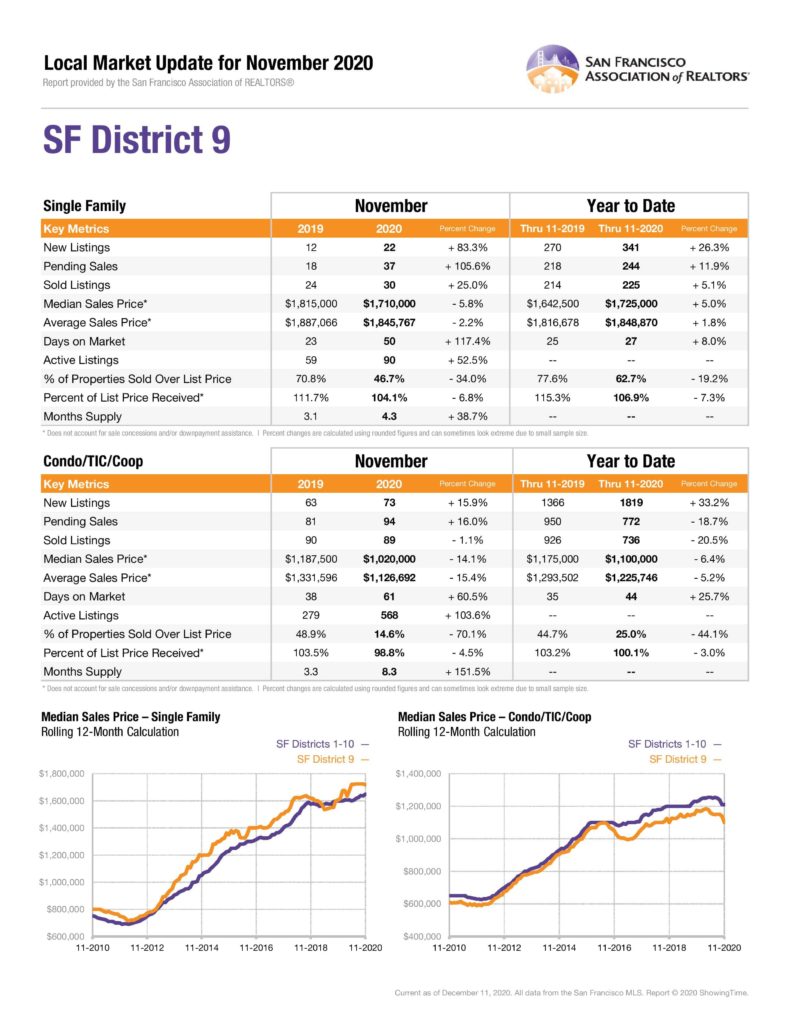
District 9: Central East
Bernal Heights, Inner Mission, Mission Bay, Potrero Hill, South of Market, Yerba Buena, South Beach, Central Waterfront/Dogpatch
2020 data provided by SFAR/InfoSparks
Single-family Homes in District 9, 2020
Single-family home listings and sales all increased: 26.3% more new listings, 11.9% more pending sales, and 5.1% more closed sales.
The median sale price increased by over $80,000, up 5% to $1.725MM this year.
Demand was clearly strong this year, but such a large increase in new listings led to a 2-day increase in days-on-market to 27 days on average.
The ratio of properties that sold above asking price fell by 19.2%, down to a still-impressive 62.7%.
Condos in District 9, 2020
While demand remained high for single-family homes in District 9, its condos told another tale: New listings increased by a third to 1819, while pending and closed sales decreased by about 20% each.
With supply outpacing demand, median sales price fell by 6.4% or $75,000 this year, down to $1.1MM.
The ratio of listings that sold above the list price fell by 44% to just one-quarter of listings, and the average percent of list price received fell by 3% to roughly 100%.
District 10: Southeast
Bayview, Crocker Amazon, Excelsior, Outer Mission, Visitacion Valley, Portola, Silver Terrace, Mission Terrace, Hunters Point, Bayview Heights, Candlestick Point, Little Hollywood
2020 data provided by SFAR/InfoSparks
Single-family Homes in District 10, 2020
New single-family listings increased slightly, up by 3.5% from 2019. Pending sales decreased by 11.9%, and closed sales decreased by 14.1%.
Median sales price remained stable year-over-year, showing an increase of 1% or $11,000 to $1.107MM.
Days-on-market increased by 2 days on average, up to 29 days in 2020.
The ratio of listings that sold above the list price fell by 15.5% to 67.7%, a sizable drop but not nearly as significant as in many other Districts.
The percentage of list price received fell by 5.4% to 108.6% on average.
Condos in District 10, 2020
New condo listings increased by 13.7%, while pending sales fell by 6.6% and closed sales fell 18.8%.
Median sales price was stable year-over-year, increasing just $500 or 0.1% to $775,500. District 10 is similar to District 4 with more accessibly priced condos, but in District 4 condos fell by nearly 6%.
Condos spent 2 more days on the market this year, at 44 days on average compared to 42 in 2019.
The ratio of listings that sold over the list price fell by 38.9%, down to 37.5% from over 60% last year.
Predictions for the San Francisco Real Estate Market in 2021
After all the twists and turns of 2020, predictions of any kind seem quaint. Who the heck knows what’s going to happen in the future? The answer is nobody: not you, not me, nor even Nobel Prize-winning economists. But since we’re all here, maybe you’ll indulge me in some light prognostication? Here’s how I see San Francisco real estate playing out in 2021.
As of this writing, San Francisco real estate is already in the recovery phase, crawling back from the worst depths of its pandemic slump. The recovery technically started in late April and May, when listings and sales started picking up again after falling off a cliff in March. Barring any drastic events like a new pandemic or a financial collapse, the recovery should continue to pick up speed through 2021.
The Vaccine, Obviously
The biggest factor in recovery is the COVID-19 vaccine. The faster the various COVID-19 vaccines become widely available and administered, the faster things can get back to normal. Employers will begin bringing workers back into the workplace, even if only for a couple of days a week. People who fled the city for such havens as Truckee and Boise will get bored and come back to the vibrant trappings of SF. These incremental steps back to pre-pandemic living will lift spirits and provide a much-needed boost to the economy and housing market.
Until then (and it might be a while before enough people are vaccinated), there will continue to be some great deals for buyers looking in the right places. Sellers will continue to see mixed results depending on a few factors. Properties that tick all the boxes — a functional floor plan, good condition, listed by the right agent at the right price with the right staging and marketing — will draw considerable buyer interest, as they have since the start of the pandemic. Listings that don’t meet those criteria will struggle to stand out in a market currently oversaturated with inventory (compared to the past decade that until this year had almost exclusively favored sellers).
Knowledge is Power, Price is Everything
Pandemic or not, the most important thing a seller can do is price their listing correctly right out of the gate. In San Francisco, recovery tends to have a whiplash effect. The realities of the market can turn on a dime, just like they did last March — we could be back in a seller’s market before you know it. That’s why it is crucial to work with an agent who you trust and who has their finger on the pulse of every market shift. Understanding the current market is key to correctly pricing your listing, and correctly pricing your listing is key to a successful sale.
One Last Prediction
Here’s one last, not-so-hot take: I think we’re all looking forward to moving on from 2020. Hopefully, this San Francisco market review helps you to put a neat little bow on the past year, at least in regards to real estate. When we look back, we will mourn the obscene loss of lives and livelihoods, learn from mistakes, and relegate the rest to the history books (and blogs ????????♀️).
Here’s to you, your health and happiness, and to 2021. Happy New Year, and keep in touch!
Are you looking to buy or sell a home in San Francisco? Our top SF real estate team specializes in helping sellers and buyers with a smooth, efficient, proven process. We pair personal guidance with 20+ years of experience as top SF Realtors and more than $1 billion in closed sales. We'd love to help you too!
Contact us today for a complimentary consultation. Whether you’re looking for luxury homes for sale in San Francisco or need help listing your property, we would be happy to assist as some of the best SF real estate agents.
Stay informed with our twice-monthly email updates, featuring market insights, new listings, and local news. Subscribe to receive the latest in San Francisco luxury real estate and more. We respect your privacy and never share your information.
Probably not. Yet, in our biased opinion, you should definitely sign up for our twice-monthly email for market insights, webinar invites, local news, gorgeous homes, and more. We never share or sell your information. And, when you’re ready to work with us, please email or call to discuss your plans. We’d love to help!
To provide the best experiences, we use technologies like cookies to store and/or access device information. Consenting to these technologies will allow us to process data such as browsing behavior or unique IDs on this site. Not consenting or withdrawing consent, may adversely affect certain features and functions.
Functional
Always active
The technical storage or access is strictly necessary for the legitimate purpose of enabling the use of a specific service explicitly requested by the subscriber or user, or for the sole purpose of carrying out the transmission of a communication over an electronic communications network.
Preferences
The technical storage or access is necessary for the legitimate purpose of storing preferences that are not requested by the subscriber or user.
Statistics
The technical storage or access that is used exclusively for statistical purposes.The technical storage or access that is used exclusively for anonymous statistical purposes. Without a subpoena, voluntary compliance on the part of your Internet Service Provider, or additional records from a third party, information stored or retrieved for this purpose alone cannot usually be used to identify you.
Marketing
The technical storage or access is required to create user profiles to send advertising, or to track the user on a website or across several websites for similar marketing purposes.