Statistics are generalities, essentially summaries of data generated by dozens, hundreds, or thousands of unique, individual sales.
They are best seen not as precise measurements, but as broad, comparative indicators with reasonable margins of error — and how they apply to any particular property is unknown without a specific comparative market analysis.
Anomalous fluctuations in statistics are not uncommon, especially in smaller markets with fewer sales and wide ranges in sales prices. Longer-term trends are typically more meaningful than short-term changes.
The data below from sources are deemed reliable but may contain errors and are subject to revision. Some analyses pertain to different sections of counties, depending on the data source. All numbers are approximate.
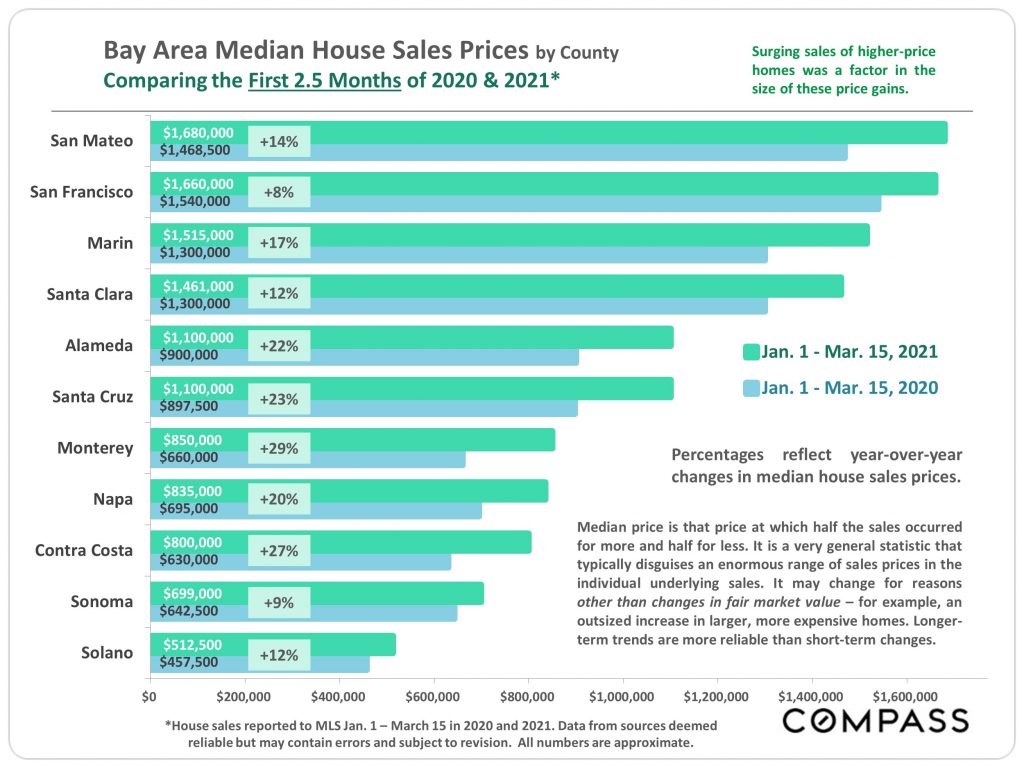
The first 2.5 months of 2021 saw a year-over-year median house sale price increase of 8% to 29%, depending on the county. (The picture for median condo prices was different.)
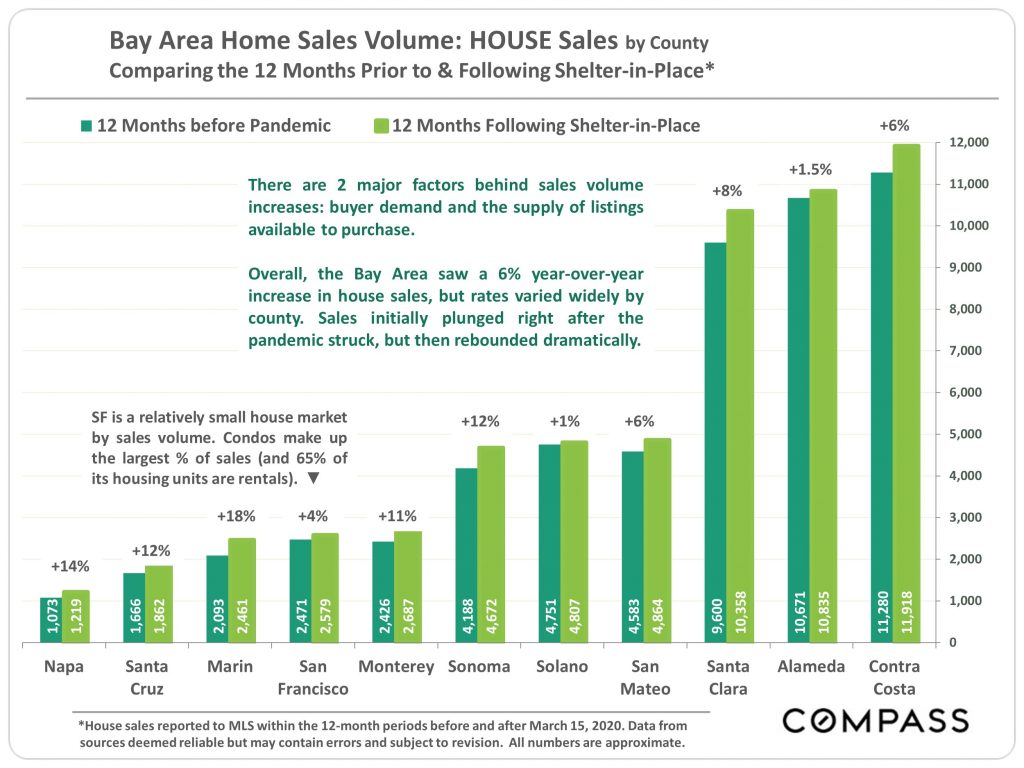
With the recovery from the initial April-May 2020 crash in activity, home sales of all prices and property types increased in the 12 months since March 15, 2020.
Since shelter-in-place was first introduced, luxury home sales were up 40% year-over-year, and ultra-luxury home sales were up 59%. (Price thresholds for these categories are explained within this report.)
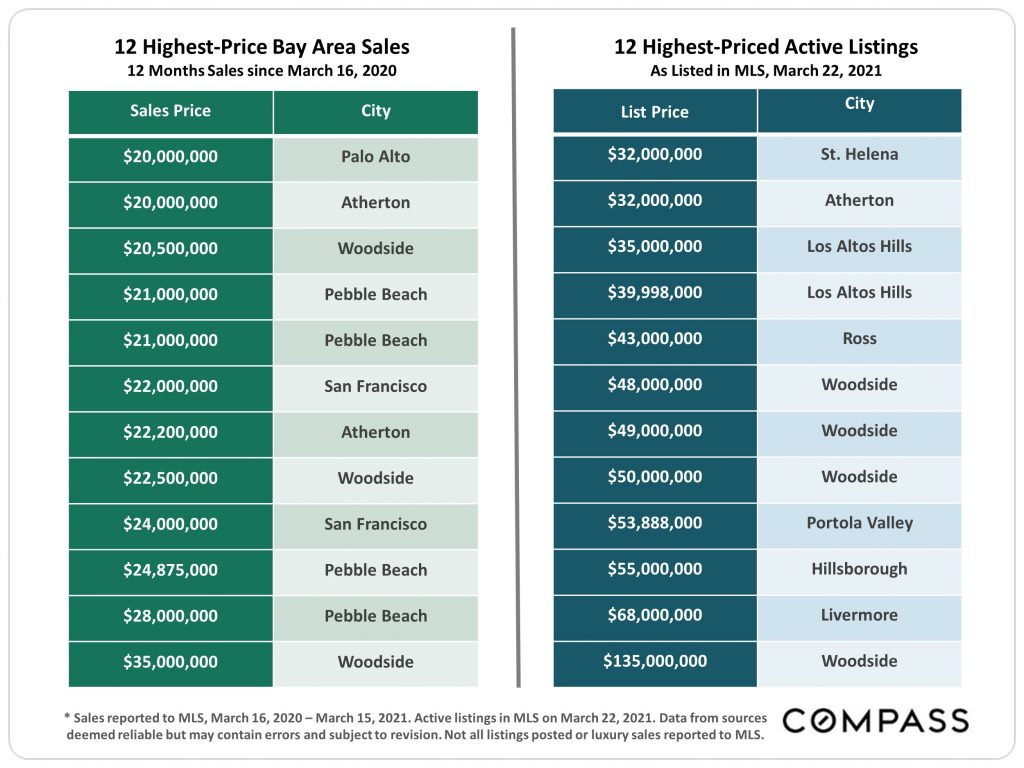
The 12 biggest sales in the greater Bay Area over the past year ranged from $20 million to $35 million. Pebble Beach in Monterey County, with 4 sales, had the highest number of these.
The 12 highest-priced listings currently on the market range in asking price from $32 million to $135 million. Eight are located in the circle of very expensive communities surrounding Stanford University.
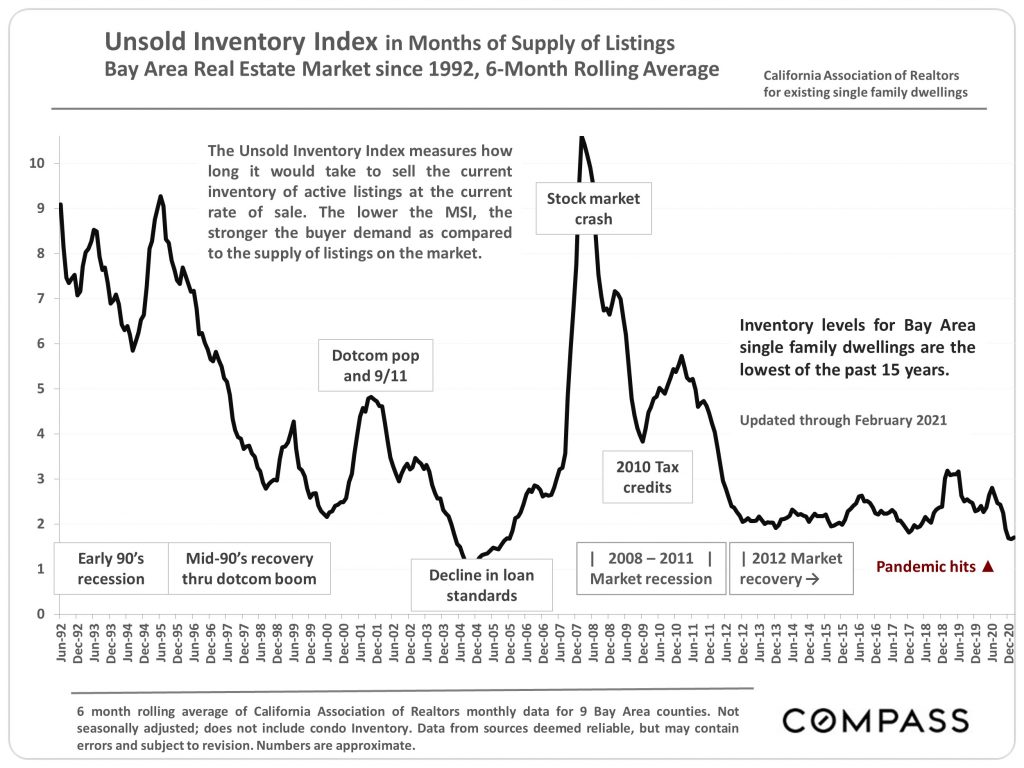
The months-supply-of-inventory level for Bay Area single-family dwellings is at its lowest point in 15 years.
Median days-on-market for Bay Area single-family dwellings are at their lowest in at least 30 years.
Single-family home prices appreciated by 20% year-over-year as of February.
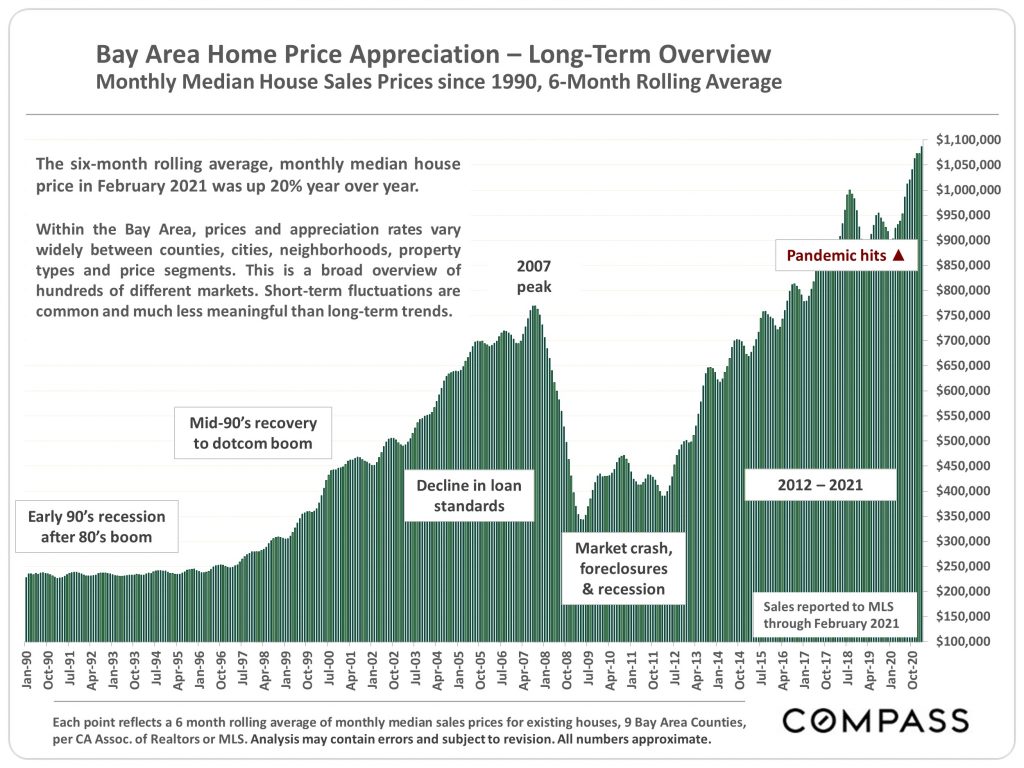
Volume of single-family home sales was up over 30% year-over-year, in the first two months of 2021.
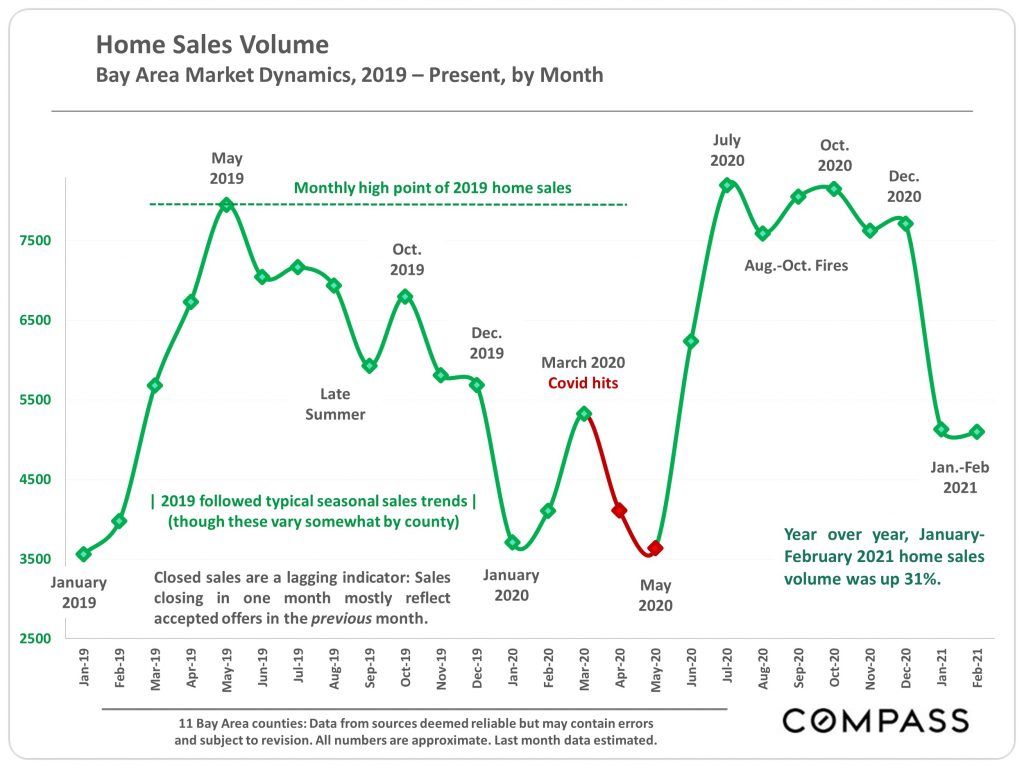
Sales volume for higher-priced homes ($2 million+) rose 84% year-over-year, giving a boost to median sales price statistics.
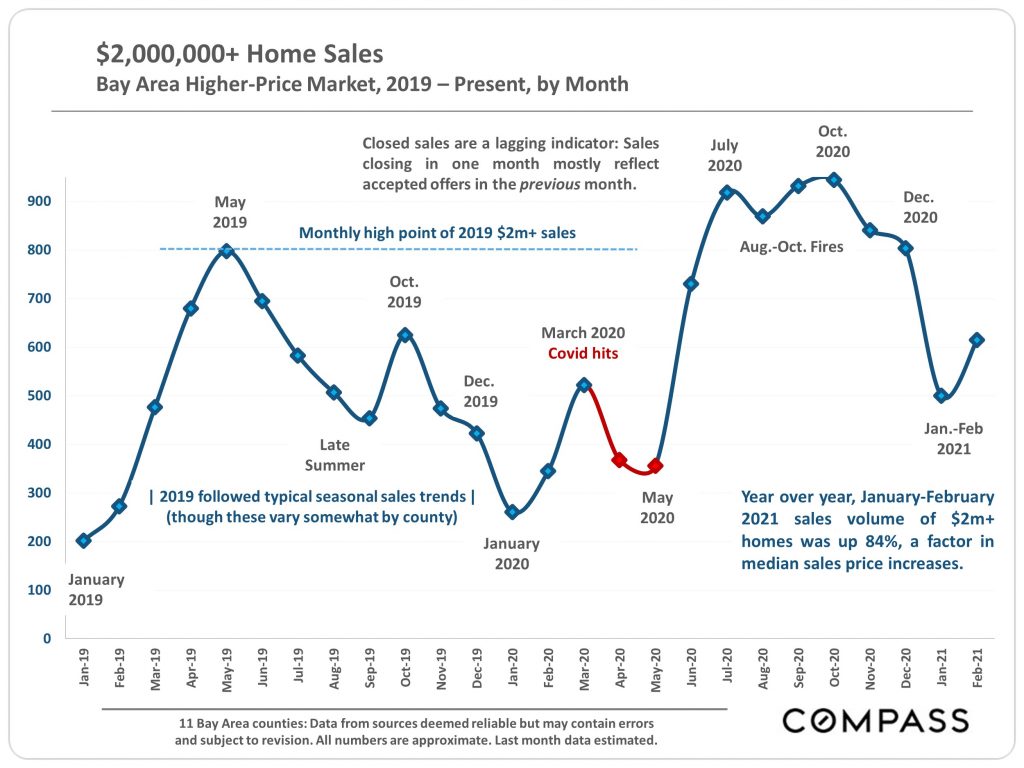
The Bay Area at large saw an increased single-family sales price of 6% year-over-year, but results varied widely by county.
Median single-family sales prices were up across the board in the Bay Area, driven by more sales of higher-priced homes.
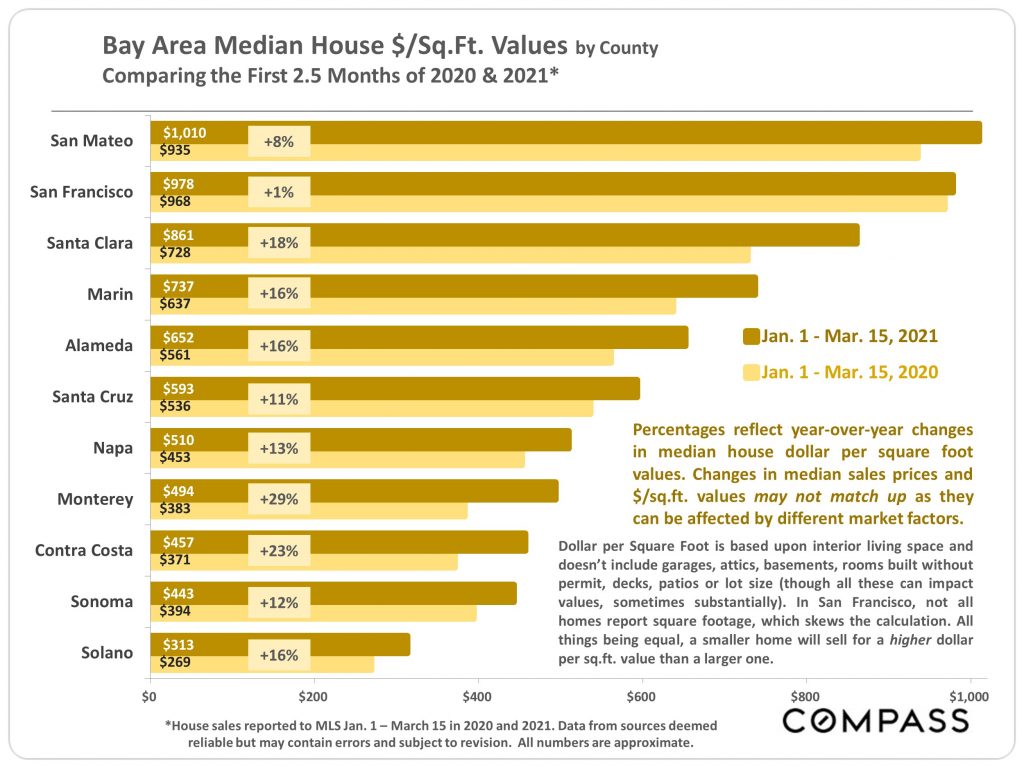
Sales price per square foot is less impacted by changing sales volume at higher or lower price points. This statistic was also up throughout the Bay Area in the first months of 2021.
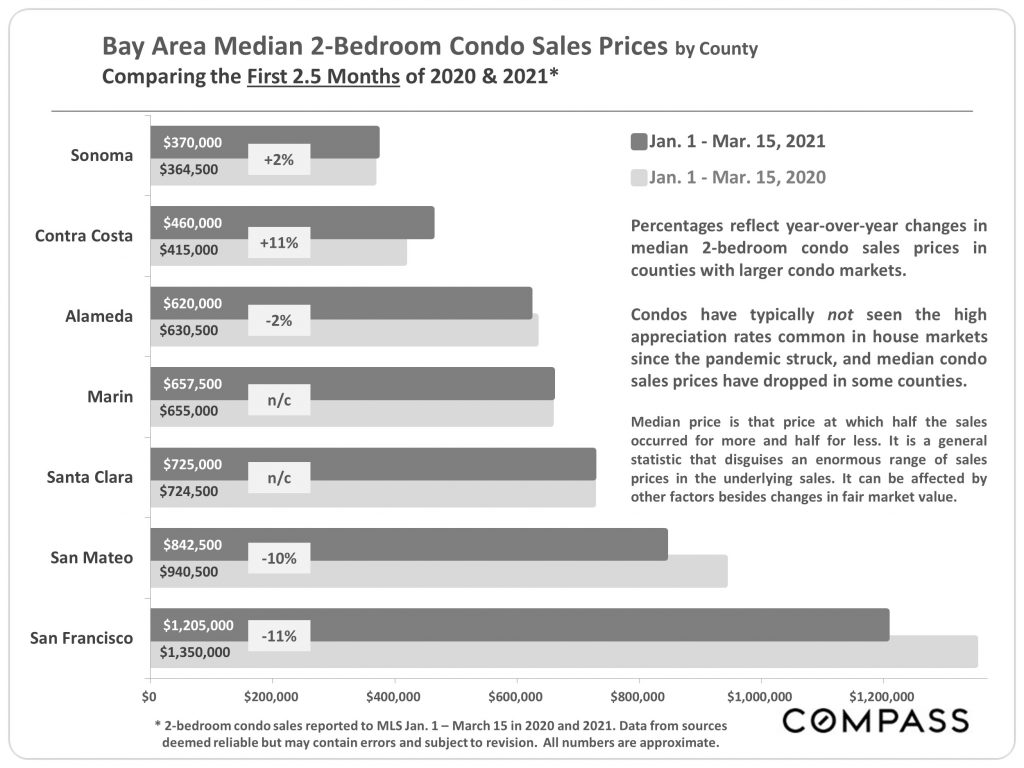
While single-family home prices have gone up, condo prices have slipped or remained stagnant at best.
Even so, condo sales volume increased in the 12 months after the pandemic hit, in every Bay Area county but Contra Costa.
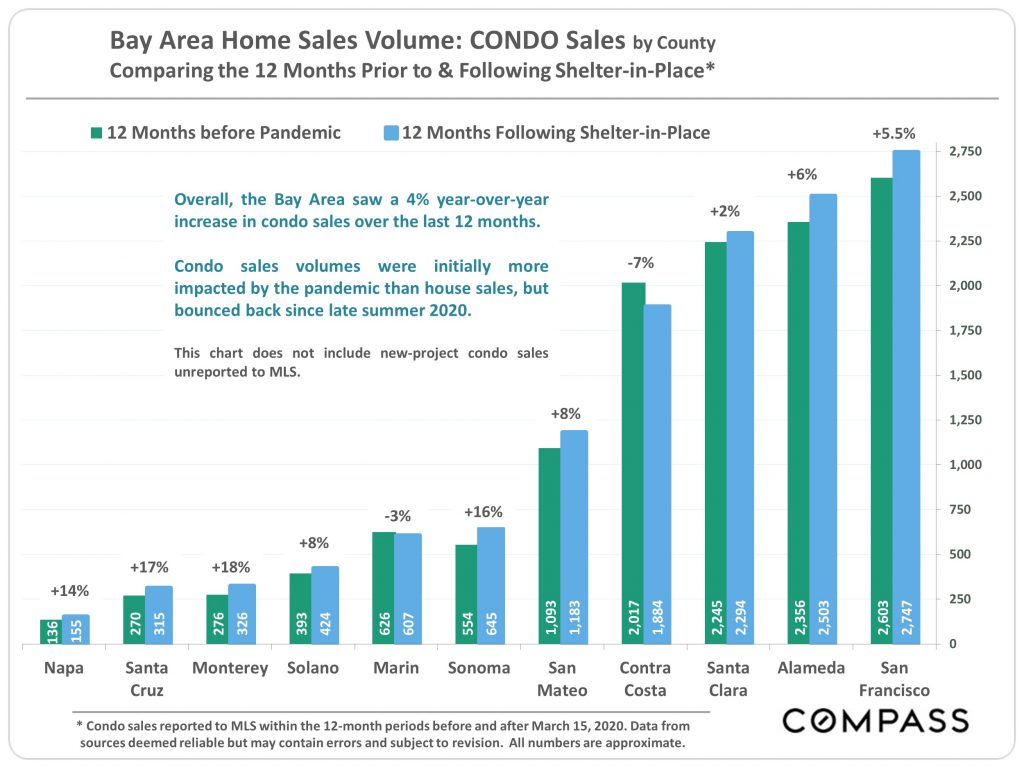
In the next two charts, the entire Bay Area luxury home market is broken up into two price segments, designated "luxury" and "ultra-luxury."
Because values vary so widely around the Bay Area, different price thresholds were used, depending on the county.
In San Francisco single-family homes, Marin, San Mateo, and Santa Clara counties, "luxury" is defined as those homes selling for $3 million to $4,999,999, and "ultra-luxury" is reserved for those selling for $5 million and above.
In Napa, Sonoma, Alameda, Contra Costa, Santa Cruz, and Monterey counties, and for San Francisco condos/co-ops, "luxury" is for sales $2 million to $2,999,999, and "ultra-luxury" is reserved for those selling for $3 million+. (San Francisco is the only county with a substantial luxury and co-op market, so it is broken out separately from SF single-family homes.)
These thresholds are relatively arbitrary, and what one gets for any price will vary enormously within and between counties. Five million might buy an 8-bedroom mansion estate with a vineyard, pool, and tennis court, or the same amount might be spent to tear down an adjacent home so the view of the buyer's existing home is improved.
In the third chart below, all $5 million+ home sales in the past year are broken out.
In most of the Bay Area, higher-price home sales exploded after shelter-in-place came into effect. This played a significant role in median sale price increases.
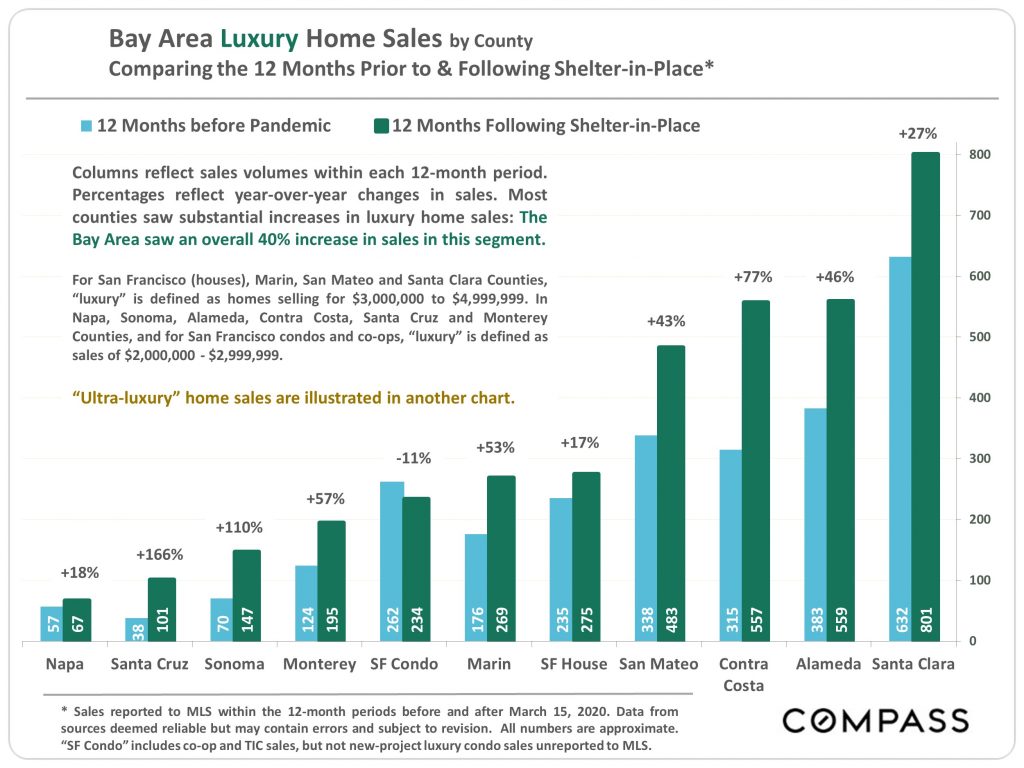
The Bay Area saw a 40% increase in sales in the luxury segment, with increases in all segments save for San Francisco condos. Ultra-luxury home sales increased even further, rising 59% overall in the 12 months after the pandemic hit compared with the 12 months before.
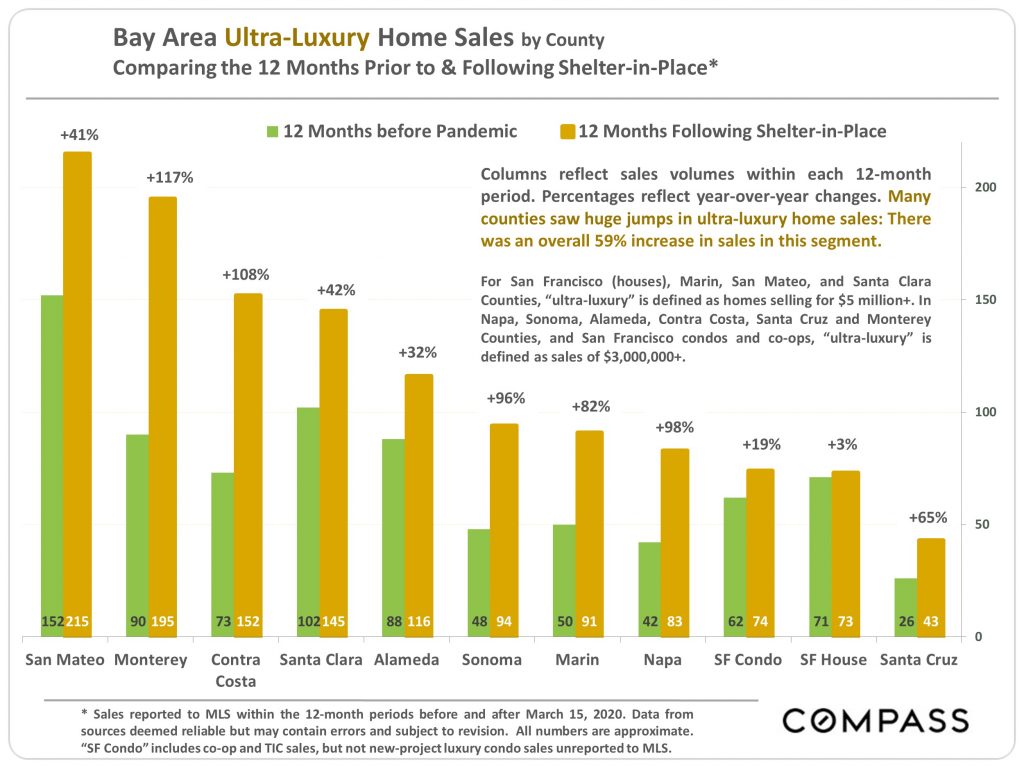
Sales of ultra-luxury homes over $5 million increased by 50% in the past 12 months, compared with the 12 months preceding the pandemic.
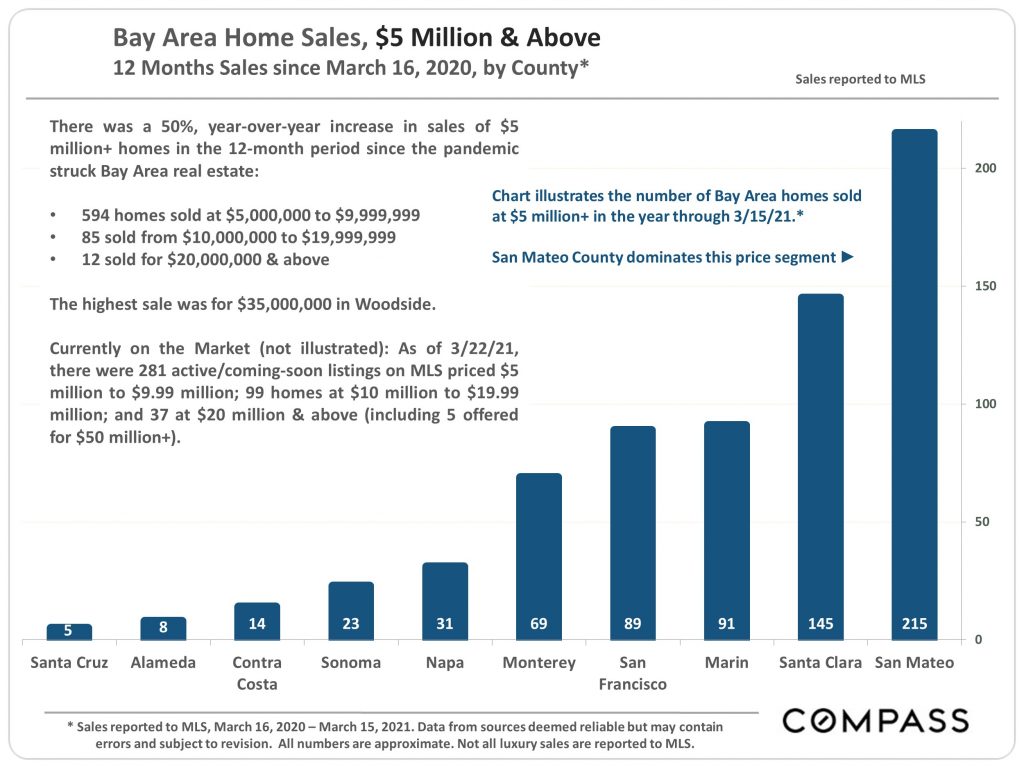
The highest-price sale since March 16th, 2020, sold for $35 million in Woodside. The highest-priced active listing as of late March 2021 was also in Woodside, listed for a whopping $135 million.
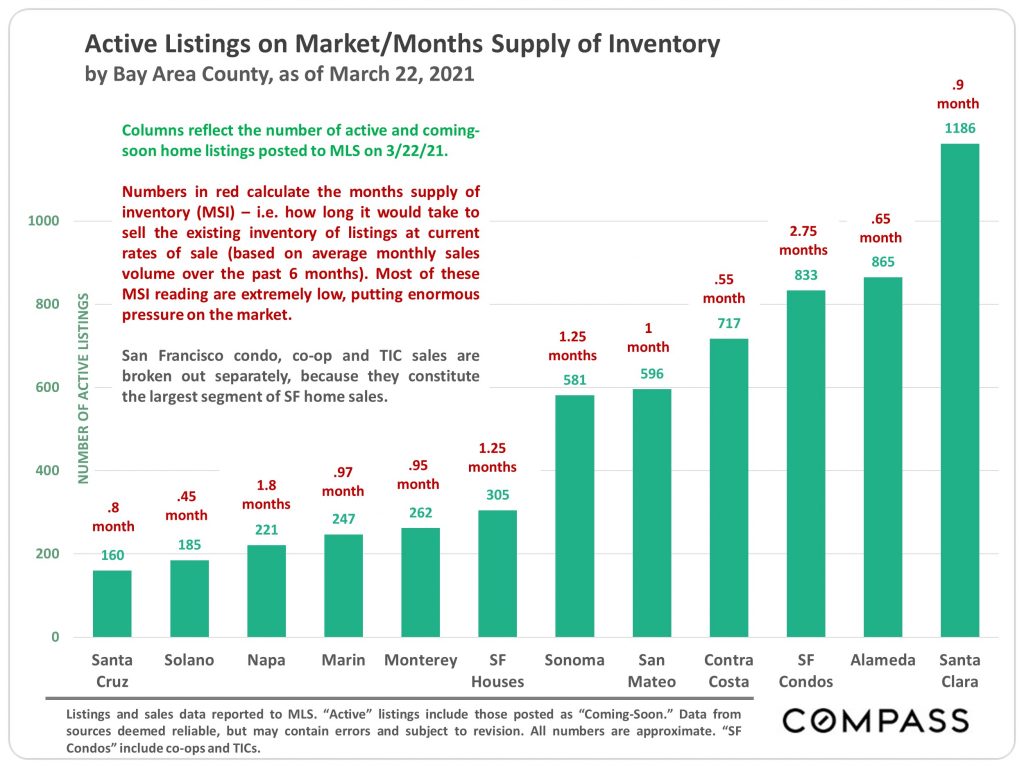
The "months supply of inventory" estimates how long it would take to sell every listing currently on the market. Most of these figures are extremely low, meaning supply is tight and competition is fierce.
Buyer demand is considerably stronger than the desire to sell among homeowners.
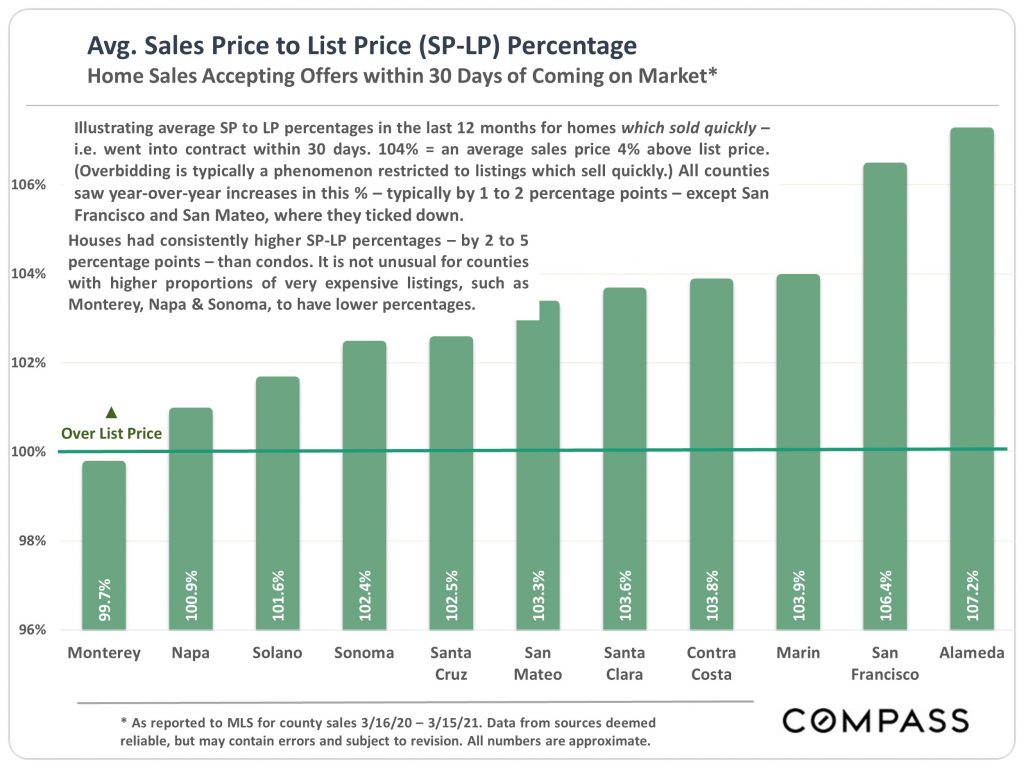
Sales-to-list-price ratio historically varies between counties, but high ratios in most Bay Area counties reflect the tight market conditions.
Between a short supply of listings and the desire for an expedient sale amid a pandemic, the median time a listing spends on the market is currently very low.
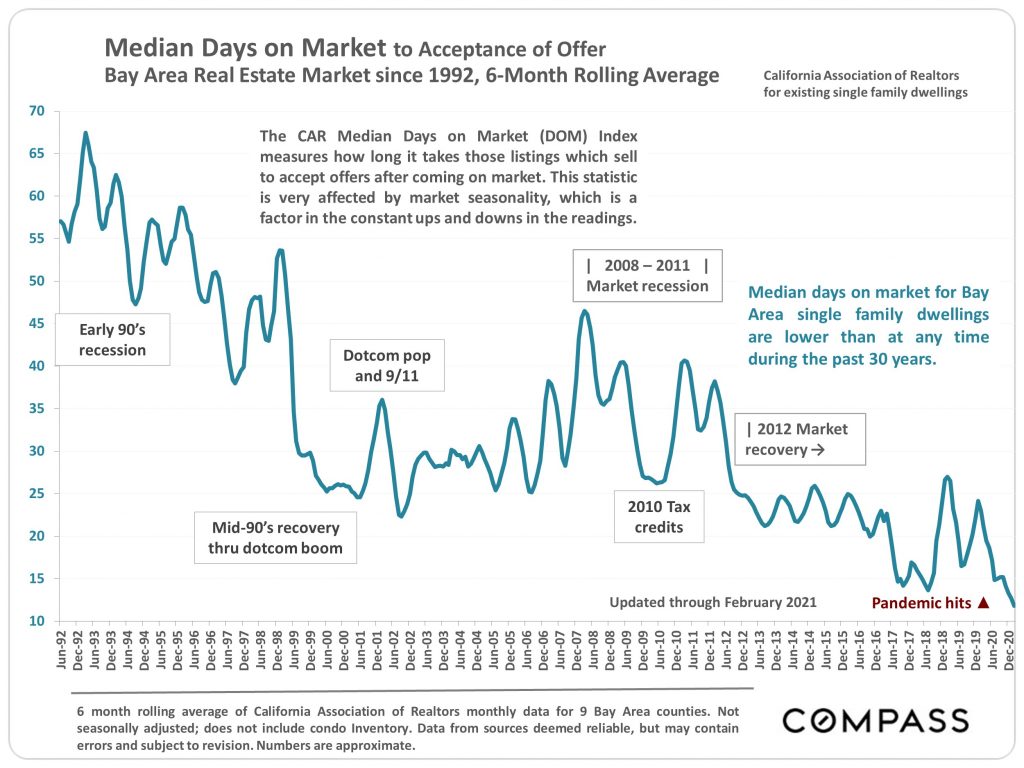
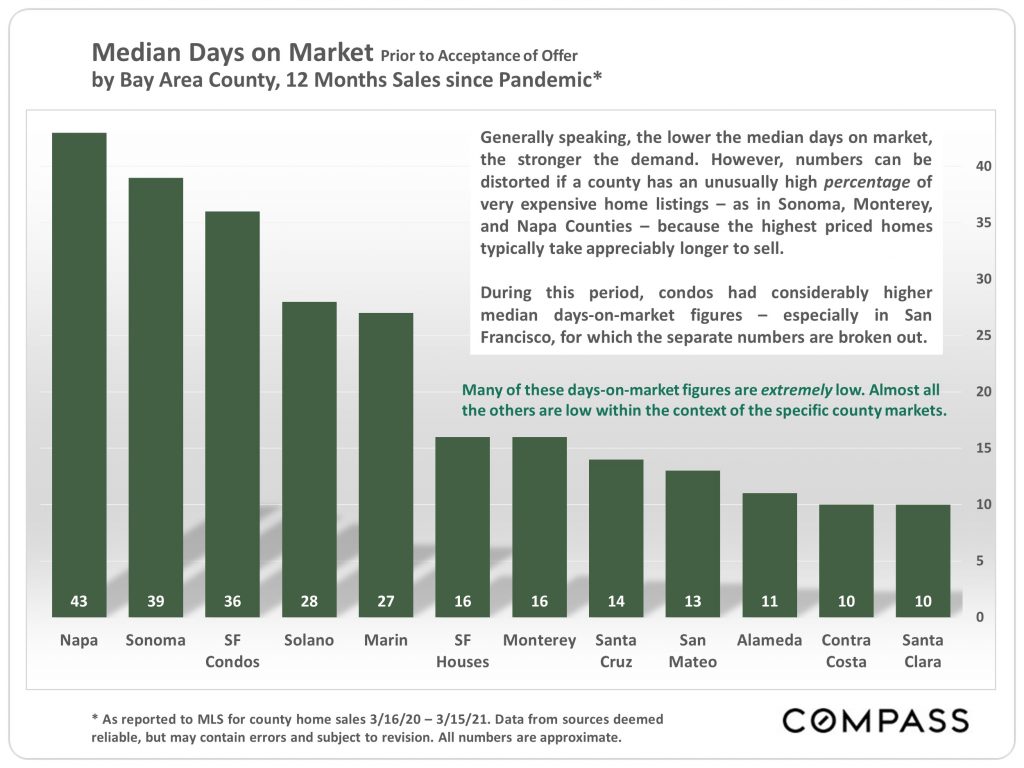
Very expensive homes tend to take longer to sell, but generally, listings are spending very little time on the market these days.
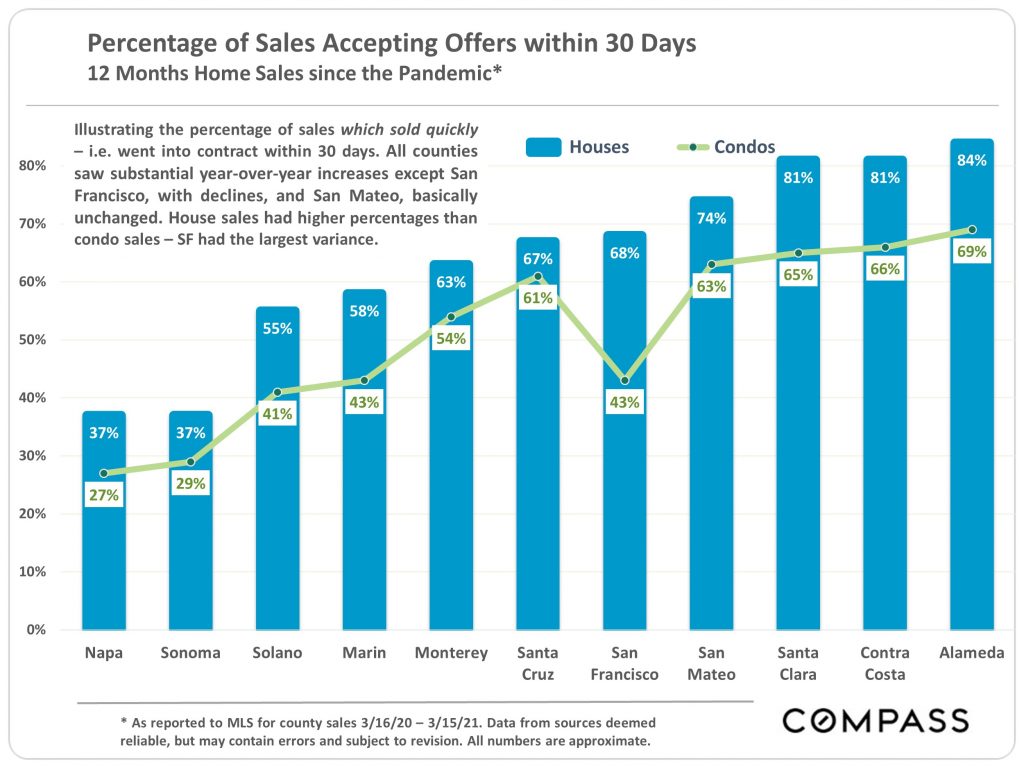
A majority of single-family homes in most Bay Area counties are sold within 30 days of listing. Condos are still lagging behind.
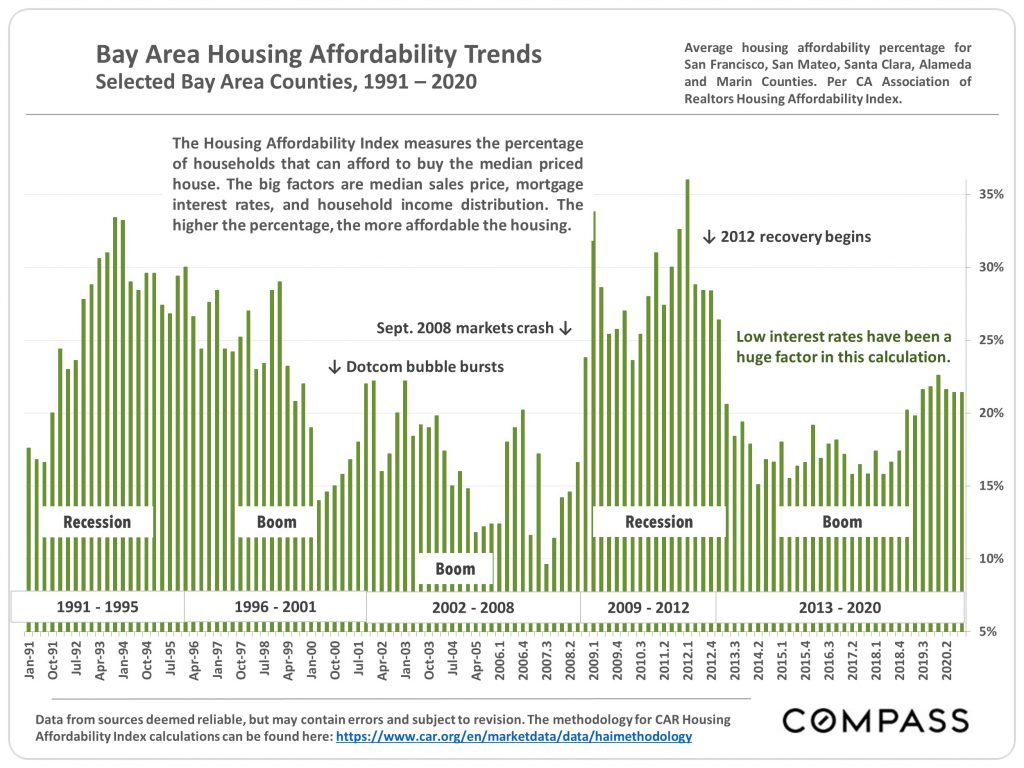
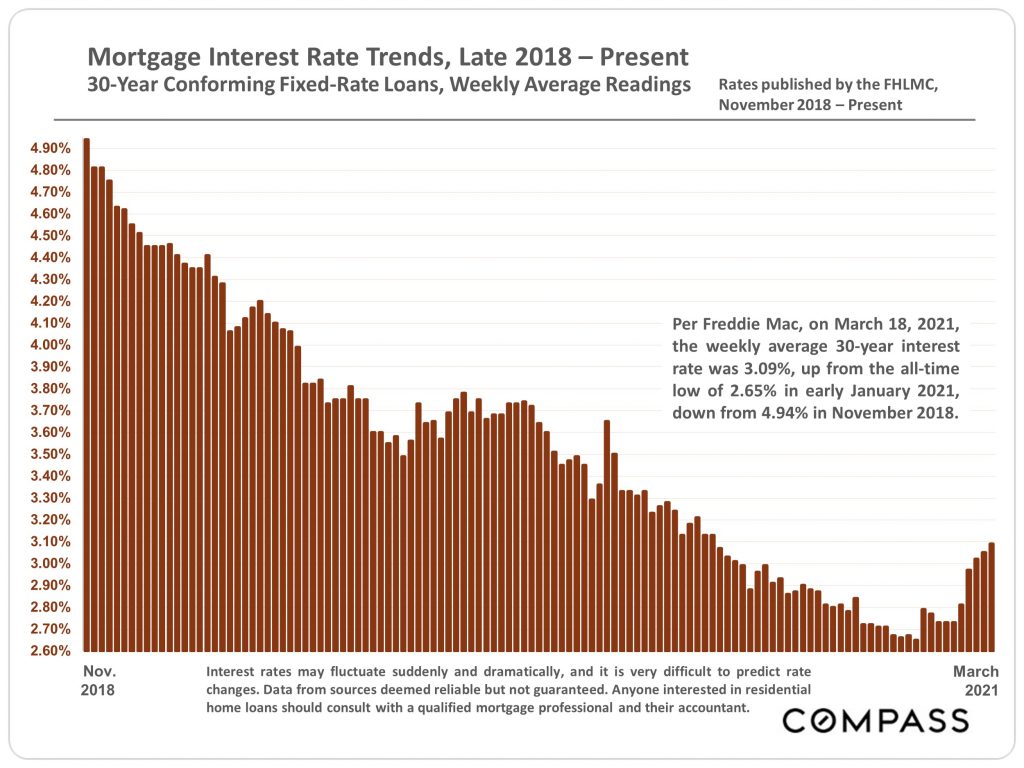
Despite rising prices, low interest rates have helped to tick up housing affordability throughout the Bay Area (though the numbers are still not very high).
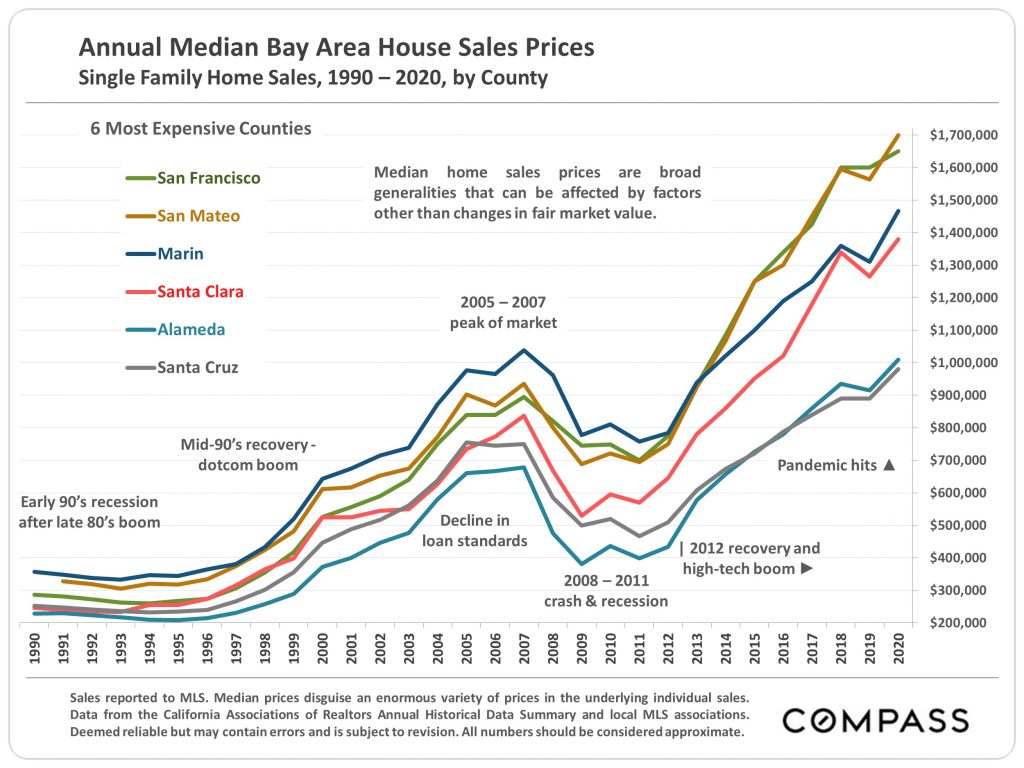
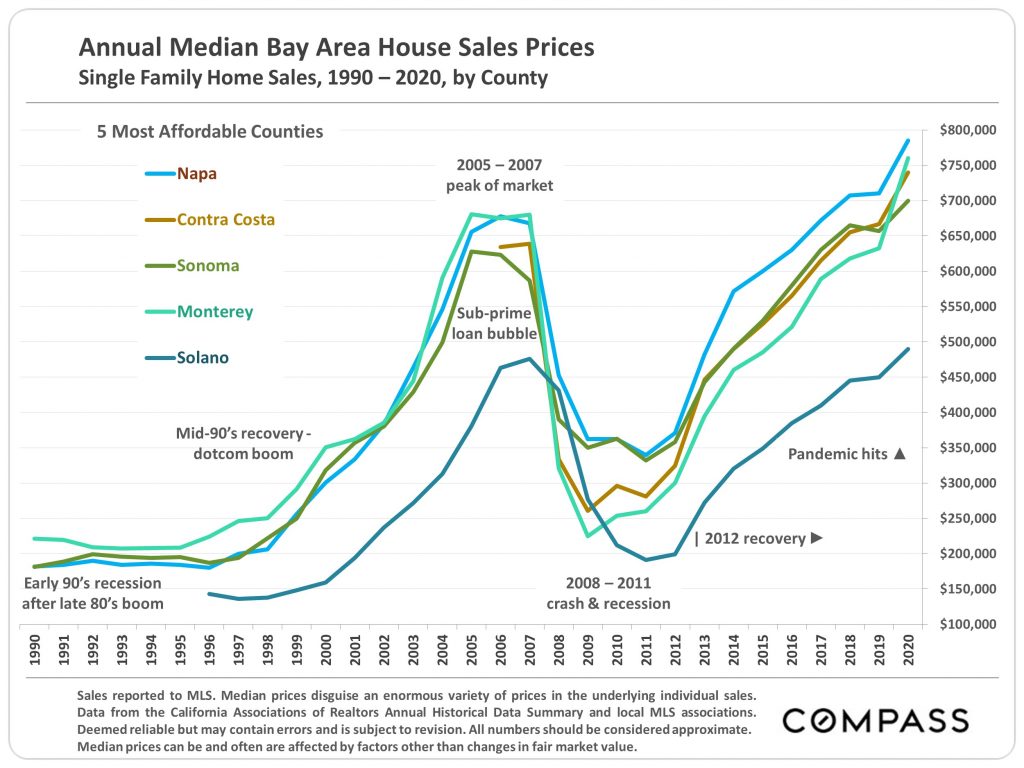
Annual, median house sales prices by county, 1990–2020
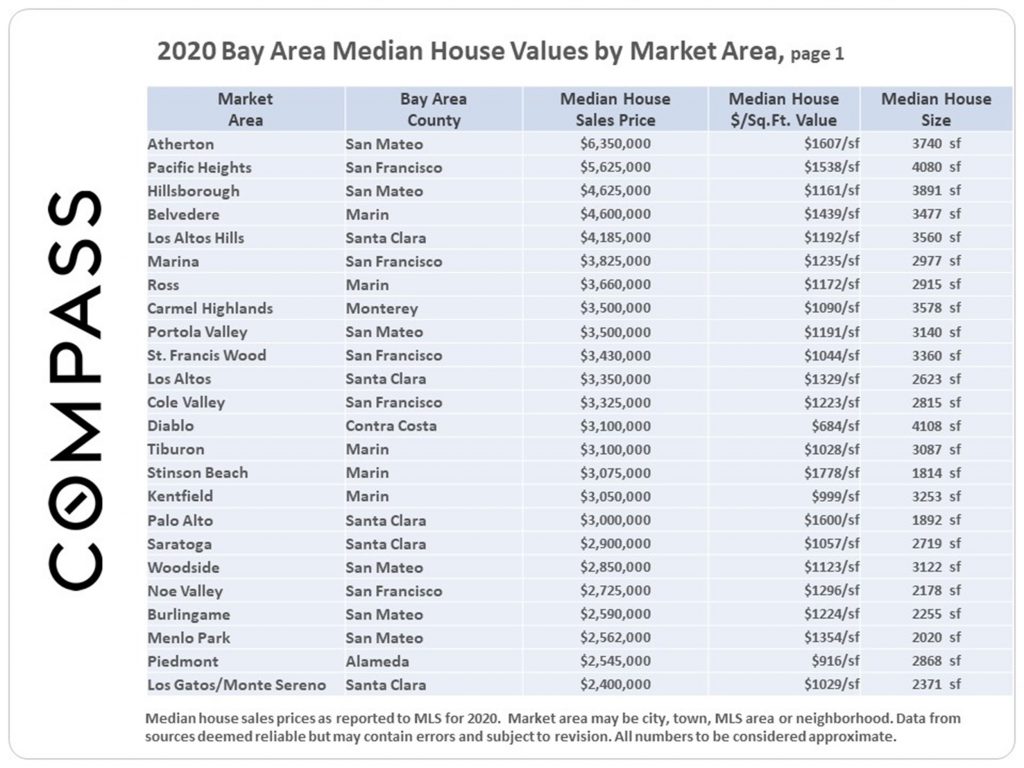
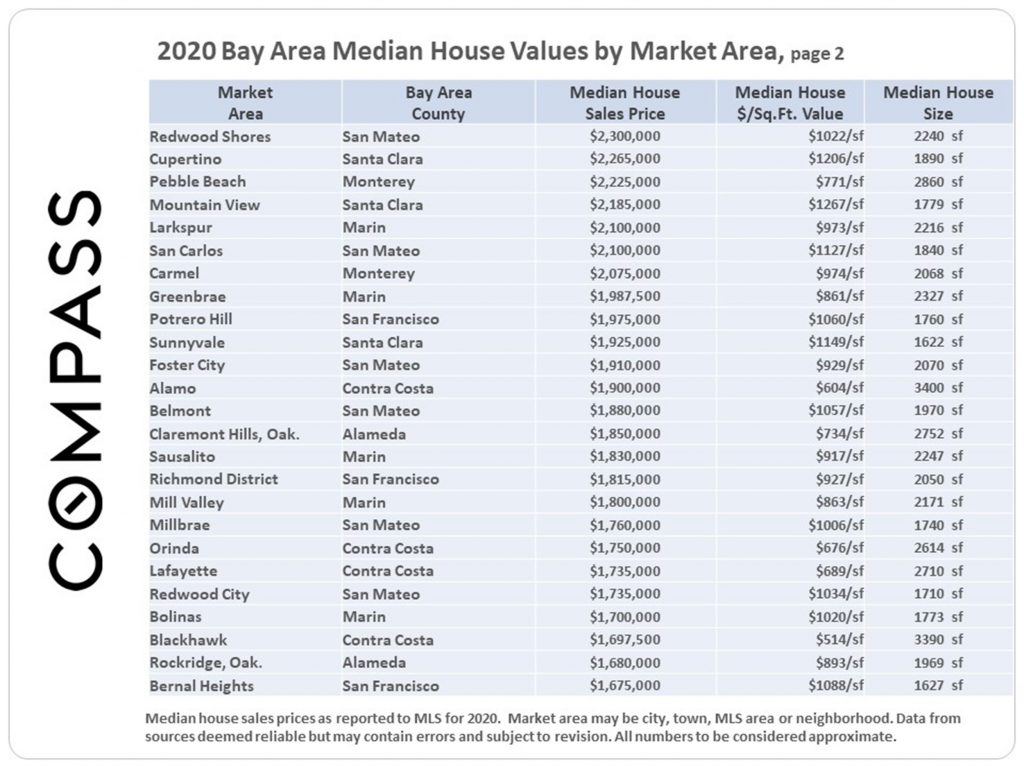
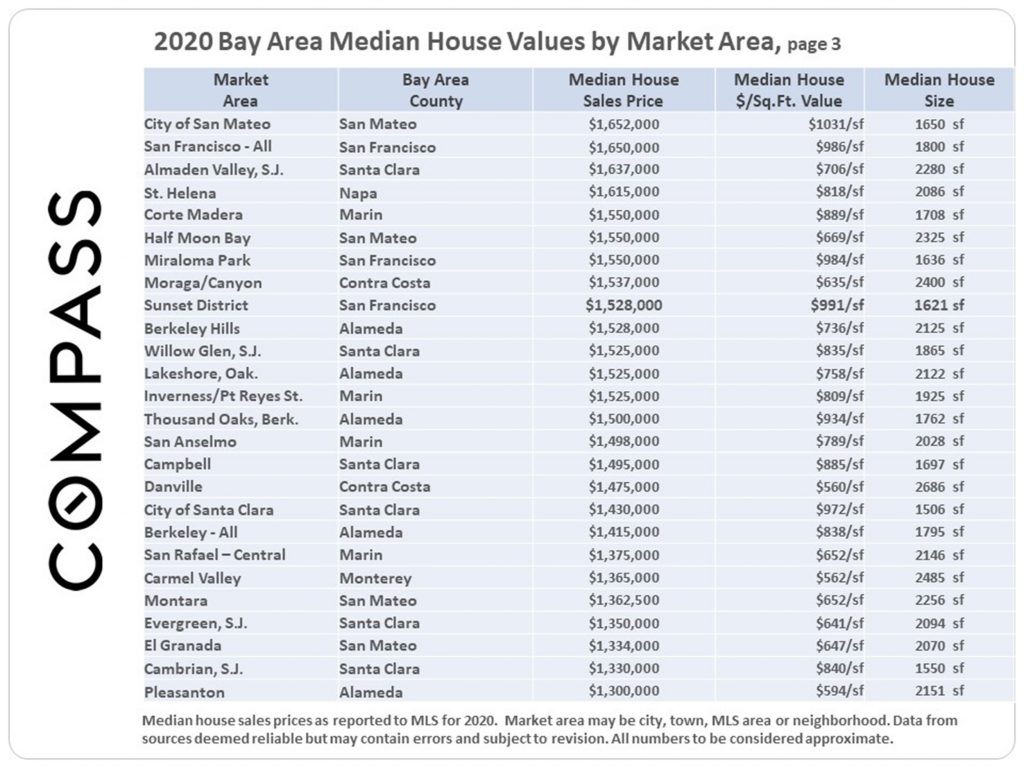
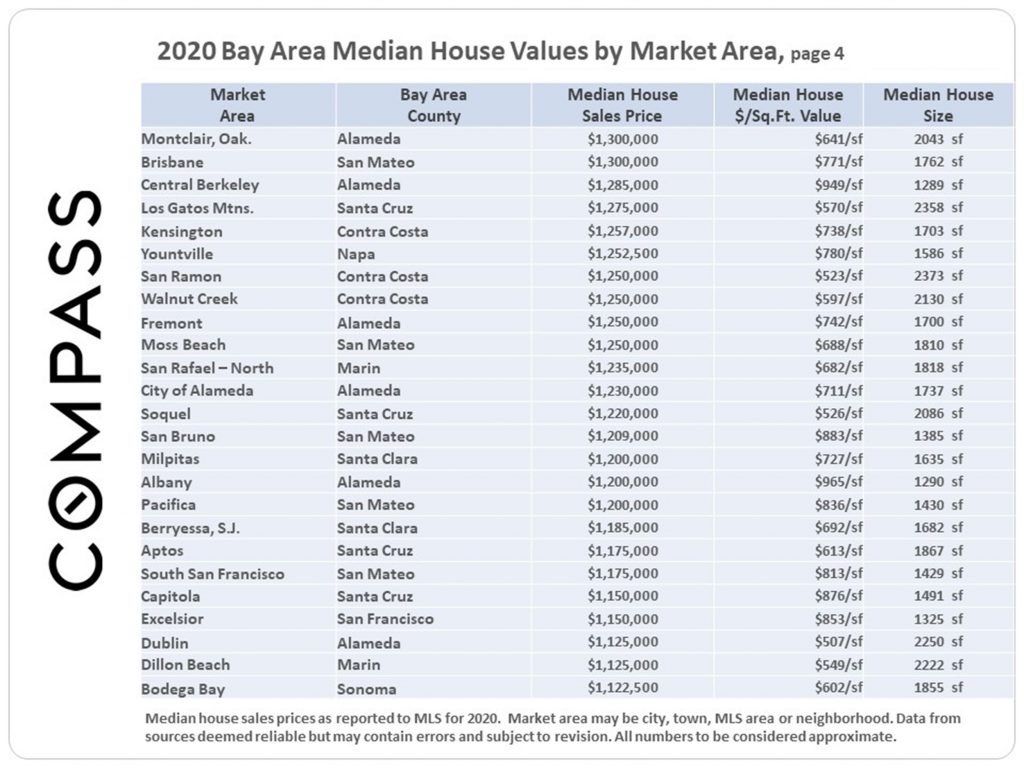
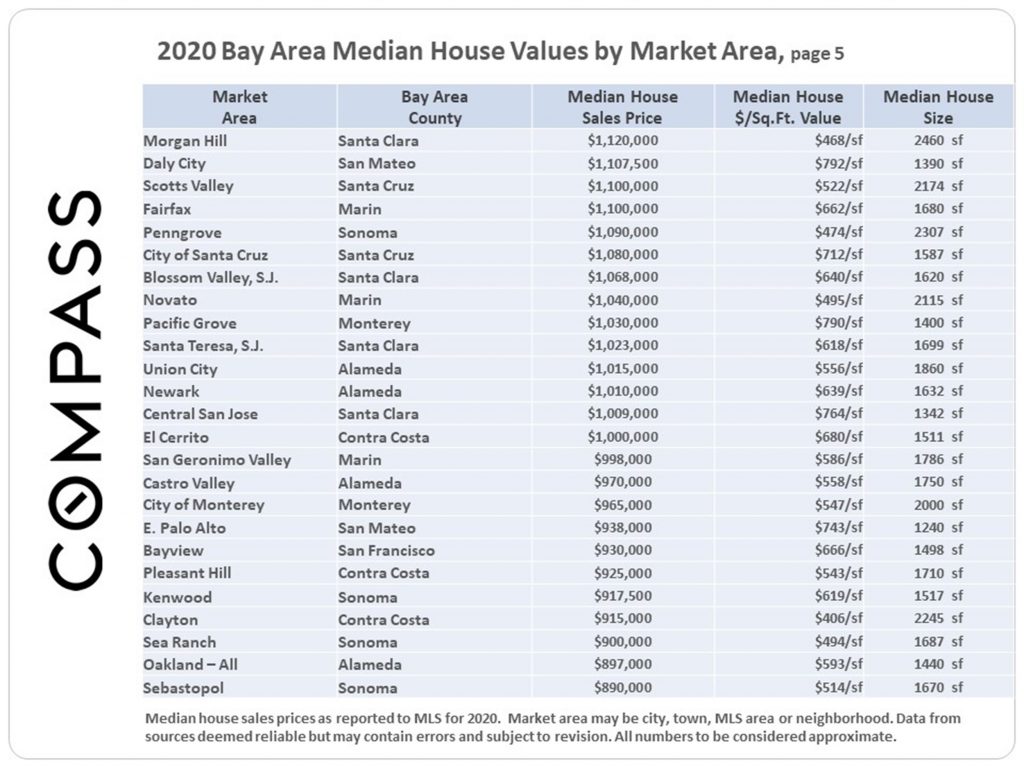
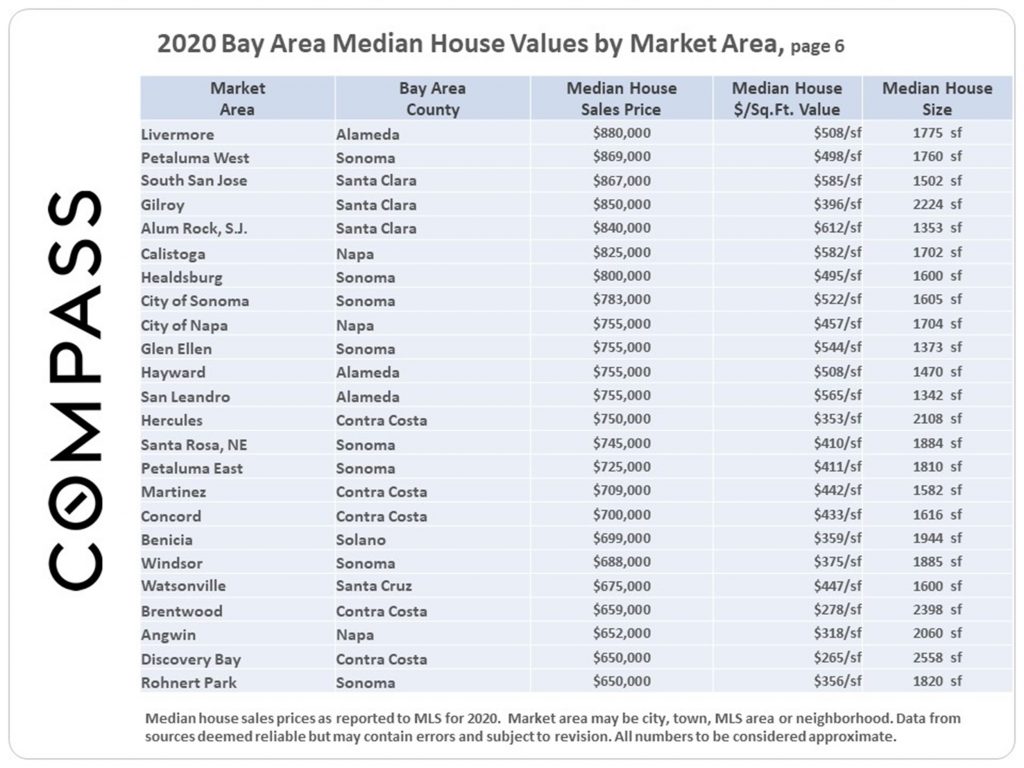
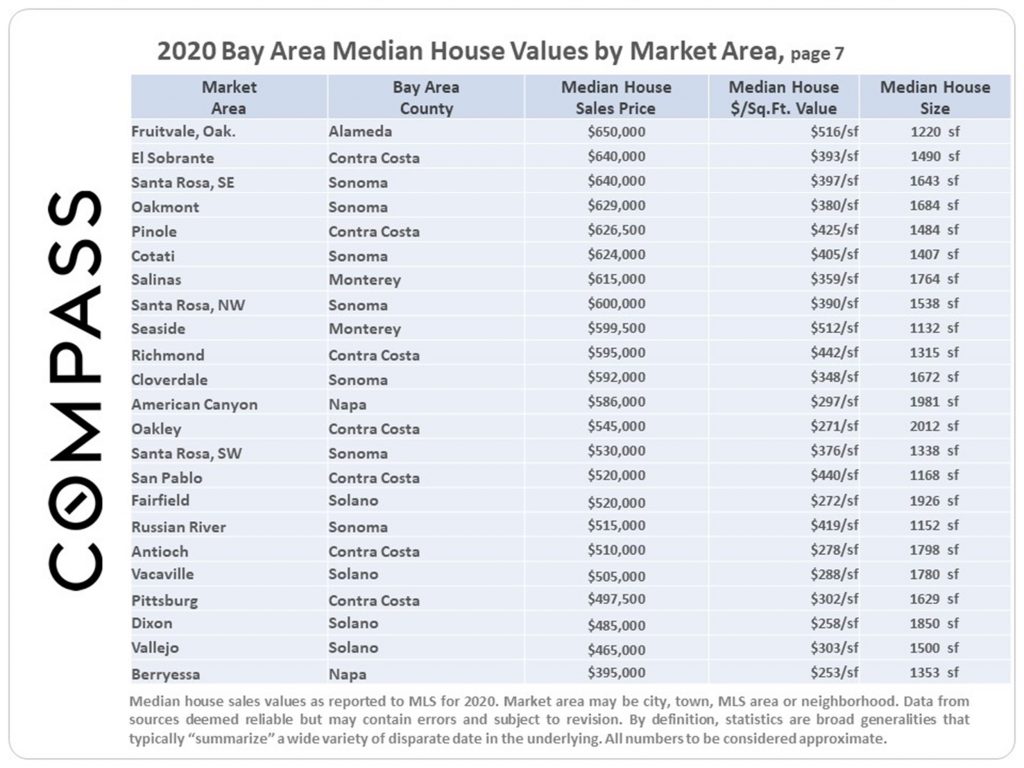
Median single-family home sales prices and $/square foot values for 125+ cities and towns across the Bay Area
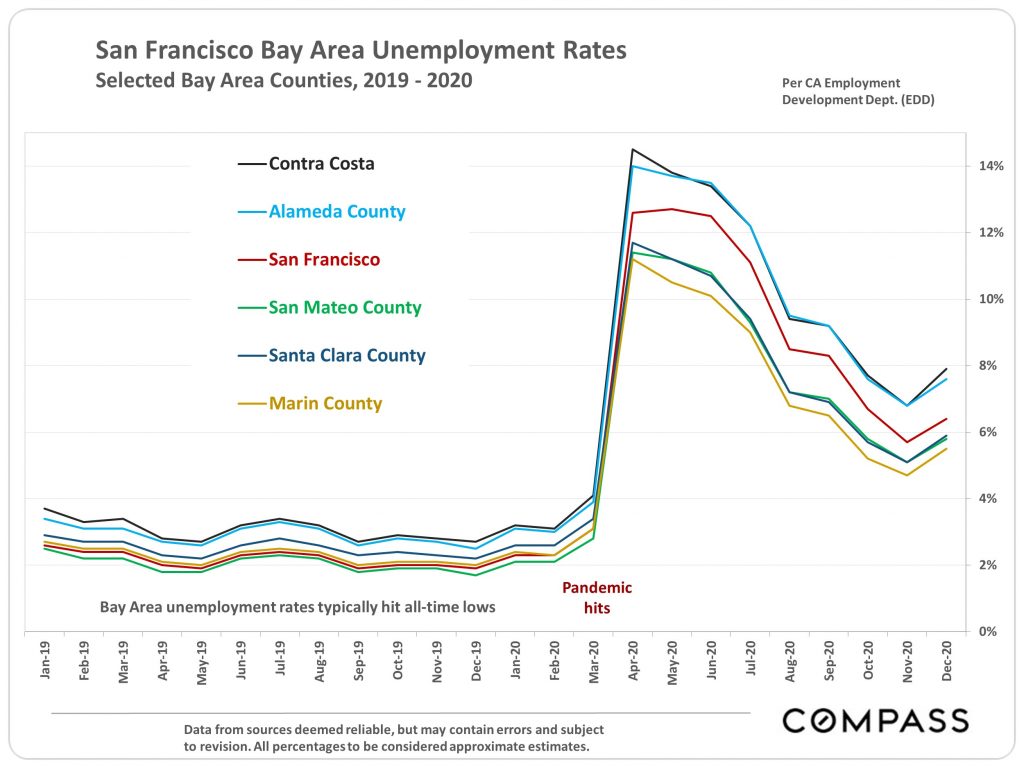
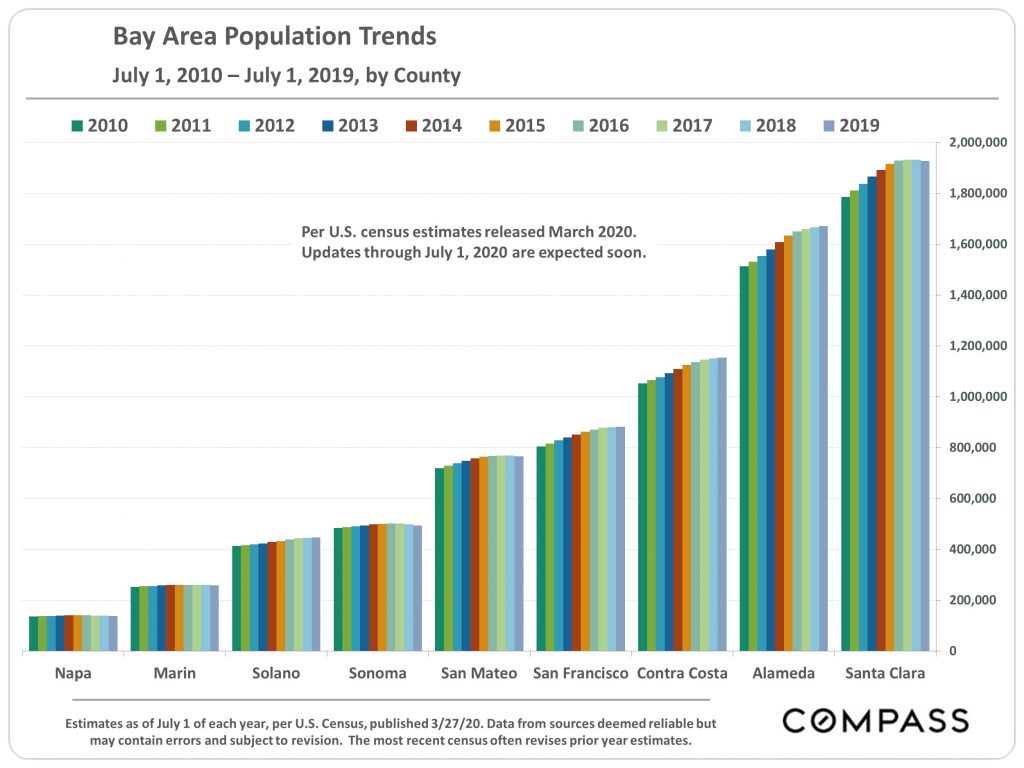
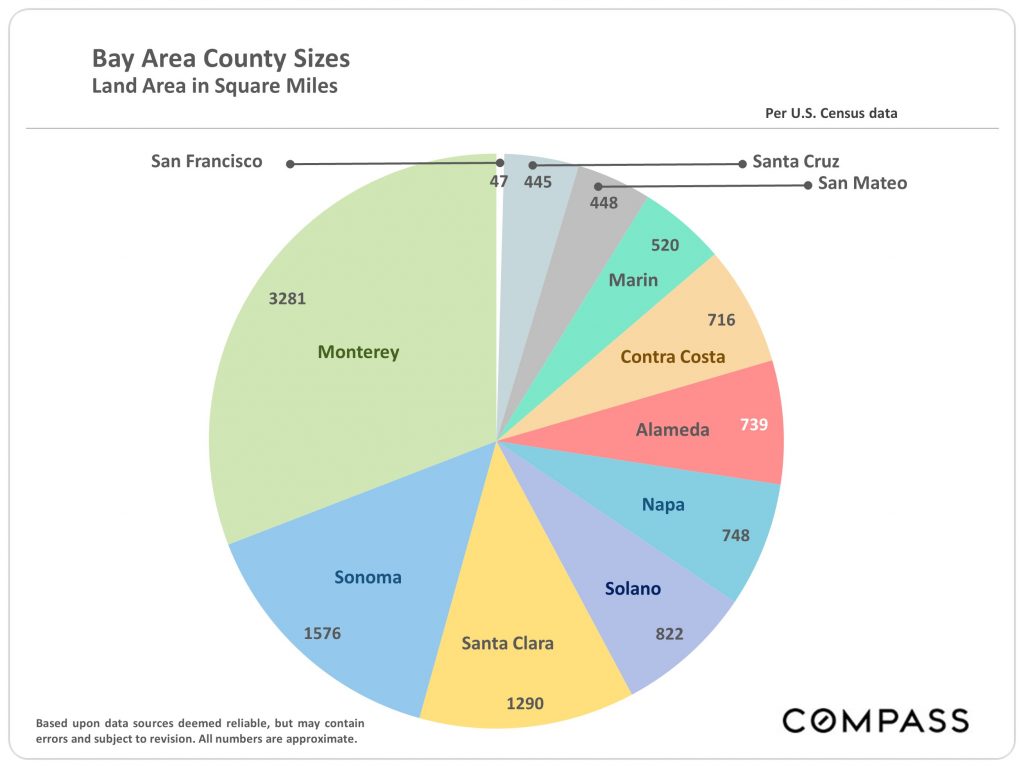
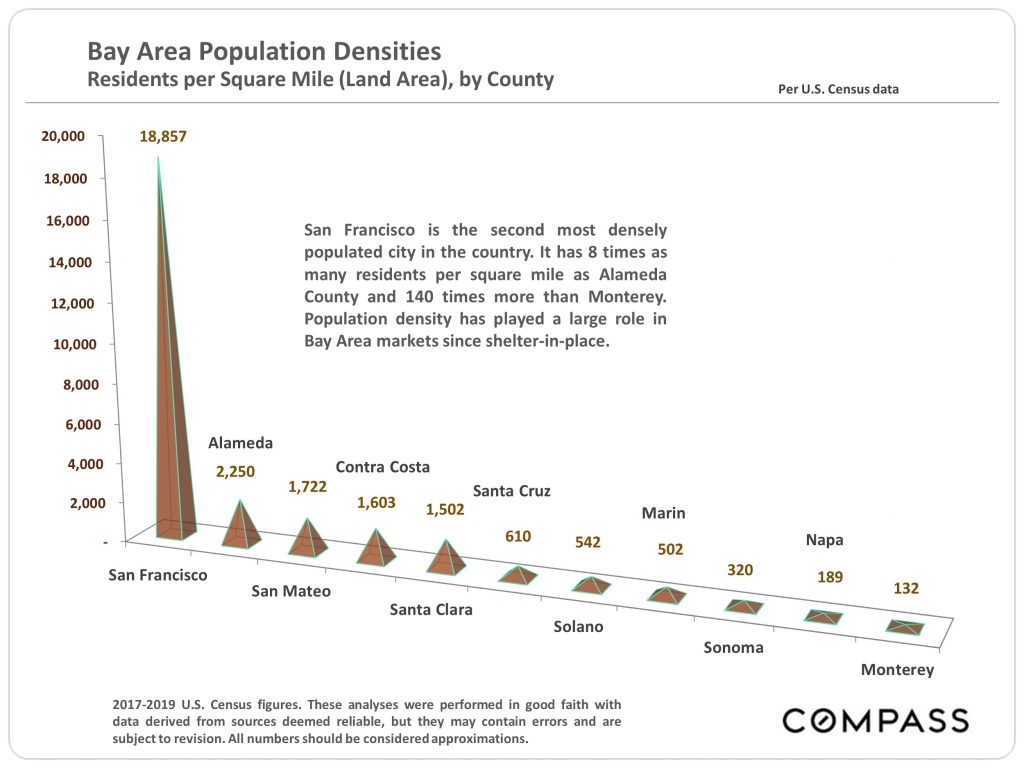
Respective populations, geographic sizes, and population densities of Bay Area counties
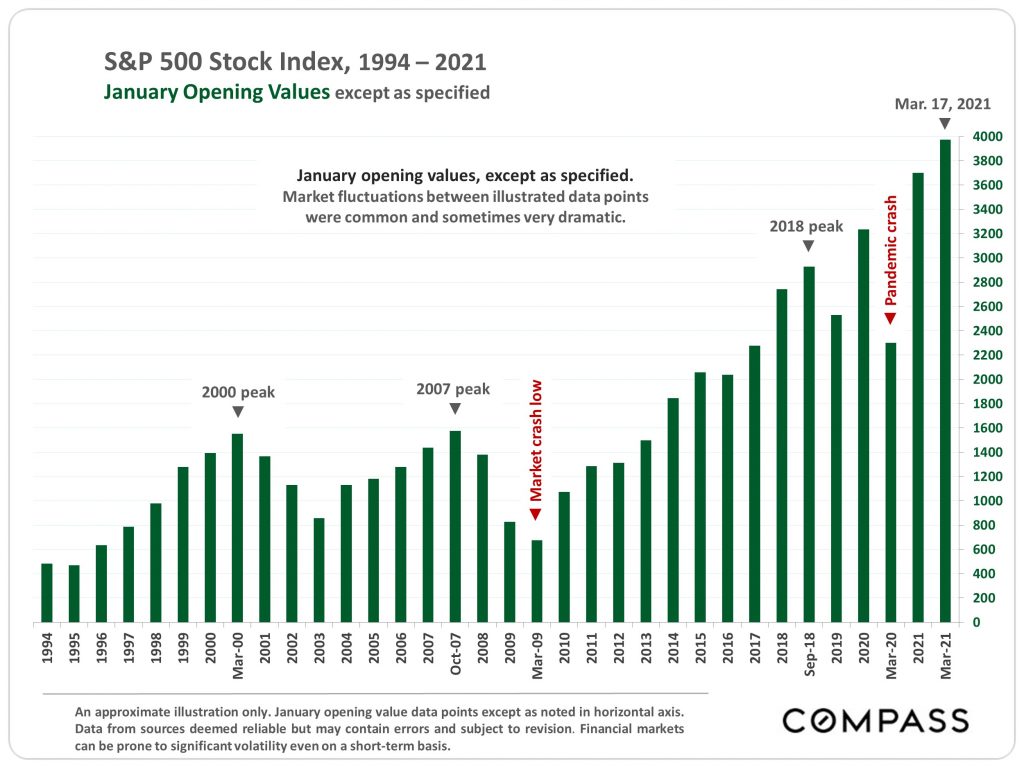
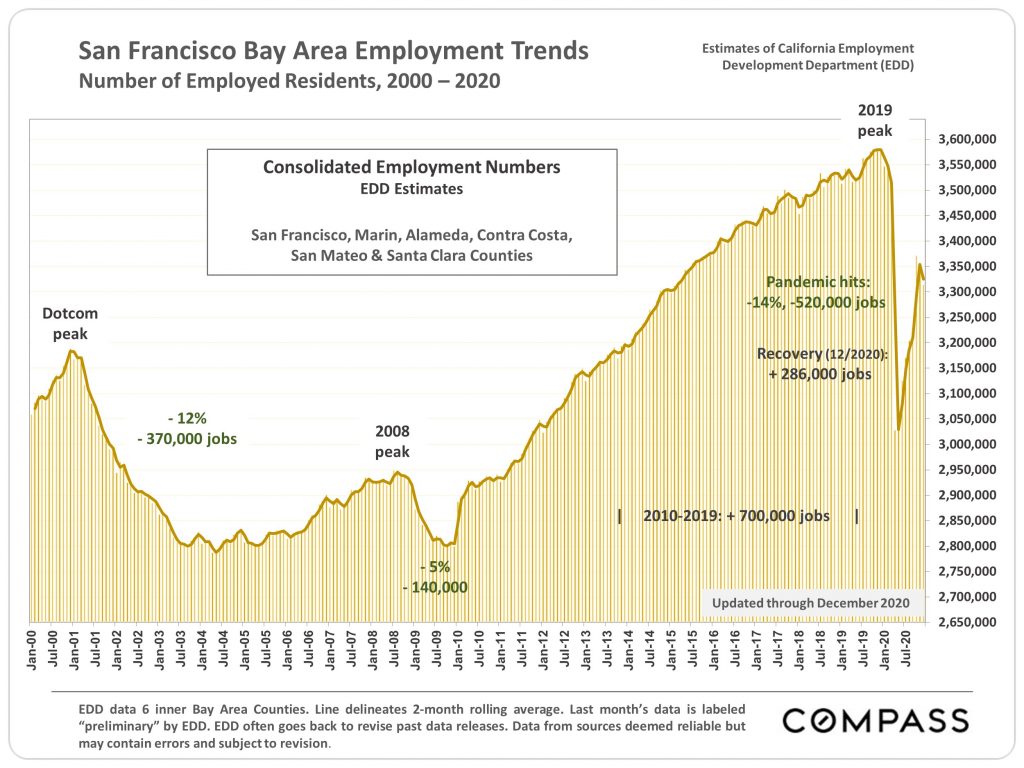
Mortgage rates and other macroeconomic factors that impact the real estate market
We hope this San Francisco real estate market data is helpful to planning your real estate goals!
If you have questions about the market, buying San Francisco real estate, or selling your home in San Francisco, please don't hesitate to reach out. We're happy to help you and anyone you send our way!
If you are thinking of selling your San Francisco property, fill out our Seller Worksheet to tell us more about your situation. If you're looking to buy a home in San Francisco, tell us your goals and timeframe in our Buyer Worksheet. Or send us a message with any general inquiries — we're always here to chat!
