Median house sales price: +9%, $1,706,000 in 2021 YTD
Median house $/sq ft value: +3%
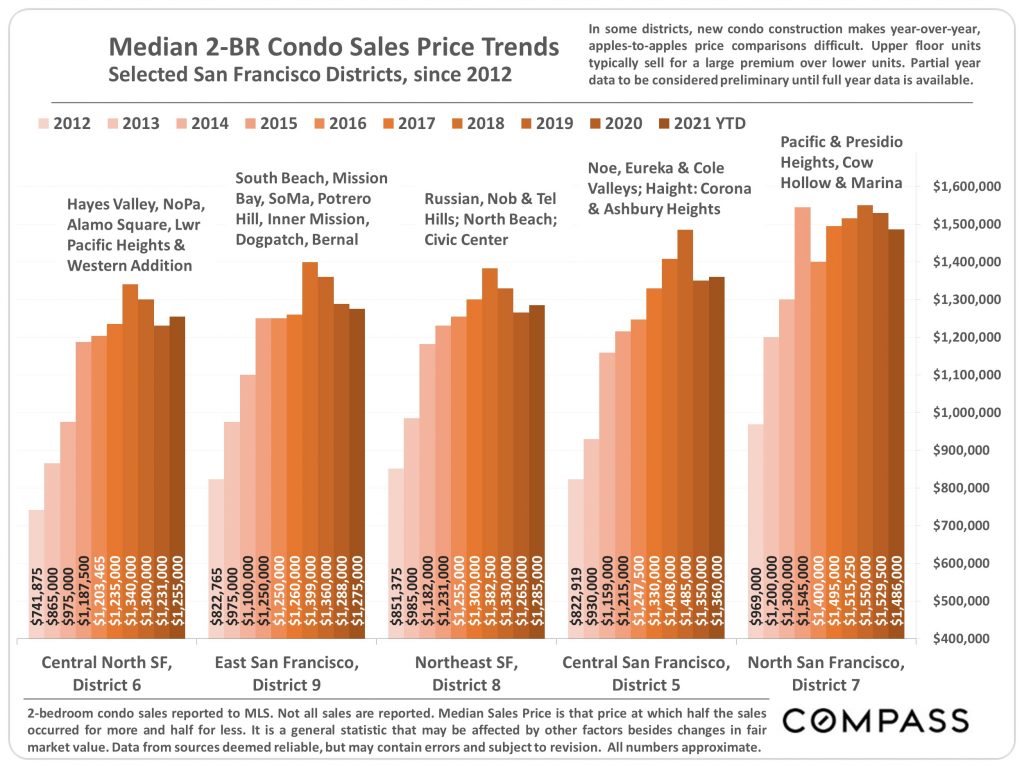
Median 2-BR condo sales price: -7%, $1,280,000 in 2021 YTD
Median condo $/sq ft value: -5%
Total sales volume: +87%
Active listings at the end of the month: +24% (4-month avg)
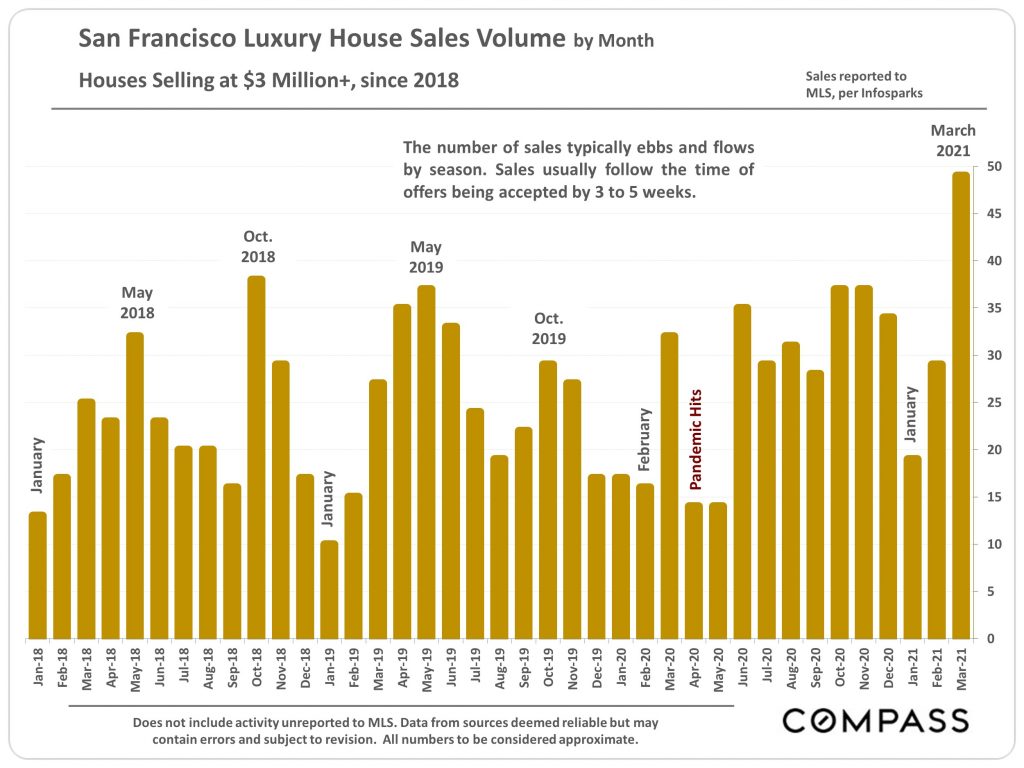
Luxury house sales, $3MM+: +99%
Luxury condo & co-op sales, $2MM+: +101%
(The pandemic and shelter-in-place had a large impact on April 2020 sales figures.)
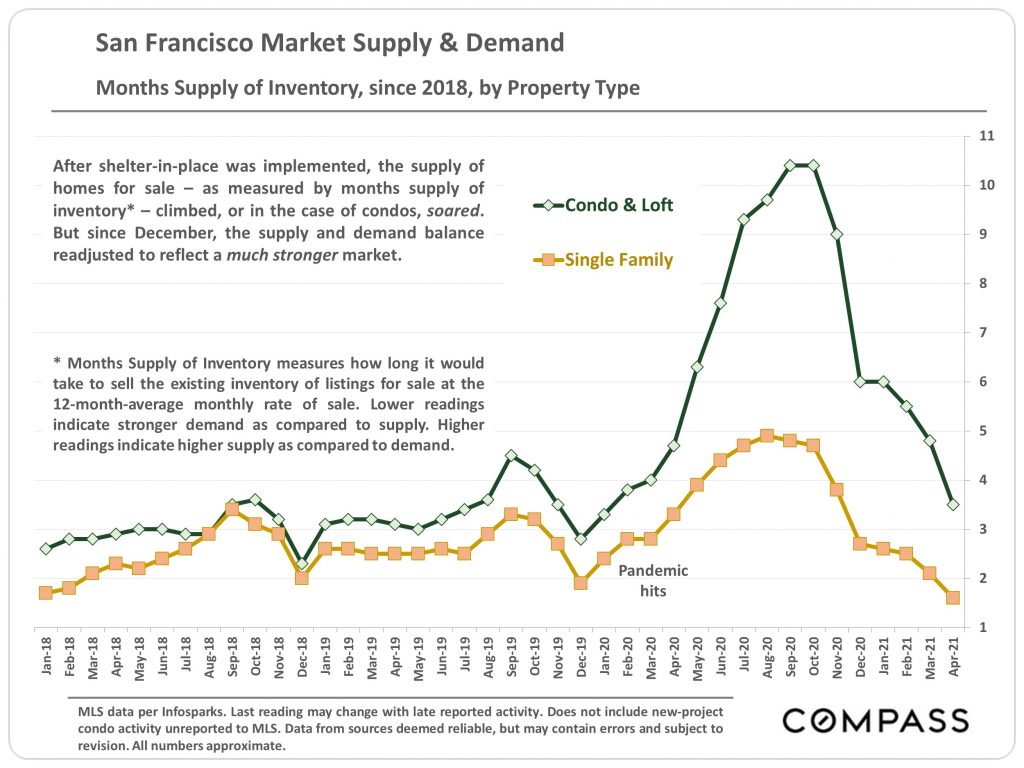
Months supply of inventory, houses: -21% (less supply)
Months supply of inventory, condos: +28% (more supply)
House median days on the market: down to 11 from 14 days
Condo median days on the market: up to 31 from 18 days
House % of sales above list price: flat at ~71% of sales
Condo % of sales above list price: down to 38% from 56% of sales
House median sale price/list price ratio: down to 107% from 109% of list price
Condo median sale price/list price ratio: down to 100% from 101% of list price
(Percentages over 100% indicate overbidding on the average transaction.)
Activity reported to MLS, per Infosparks. Data from sources deemed reliable may contain errors and is subject to revision. Late-reported activity may change figures, though typically only slightly. All numbers are approximate.
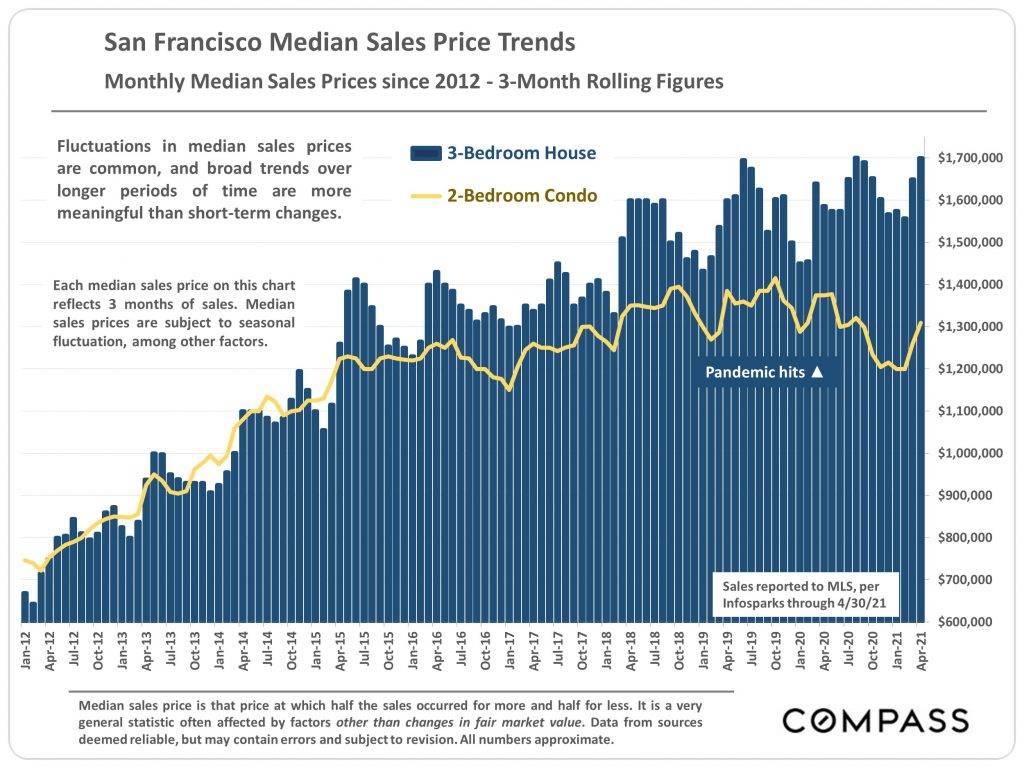
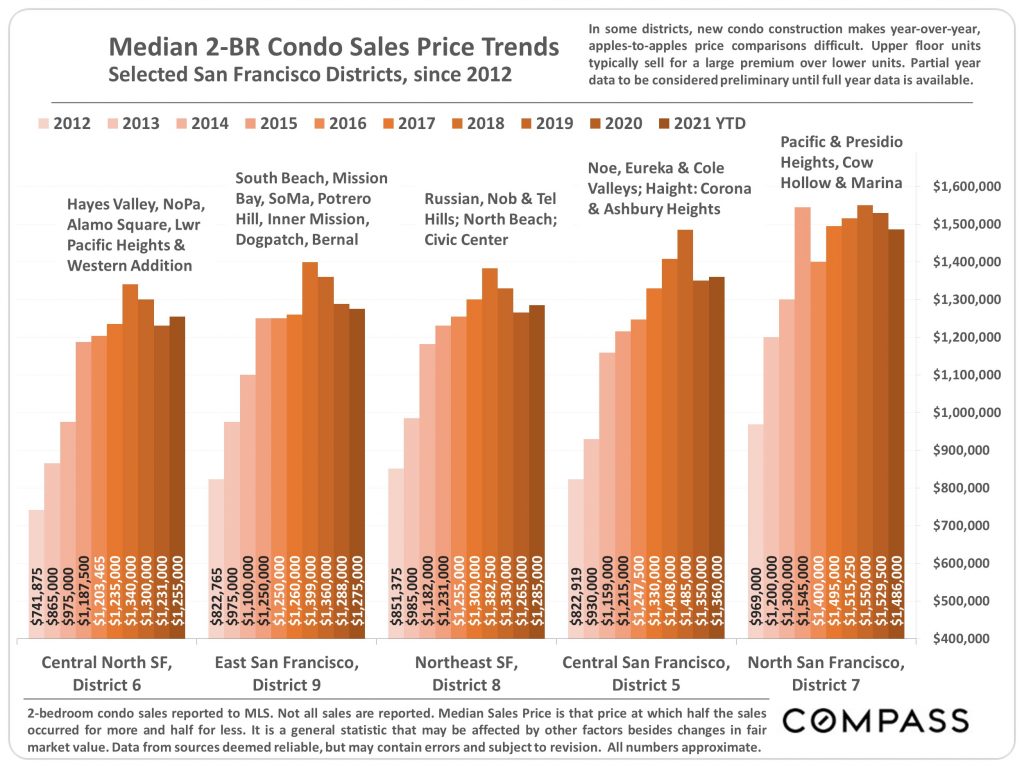
Median sales prices are trending up in both 3-bedroom houses and 2-bedroom condos, after slipping amid the early pandemic.
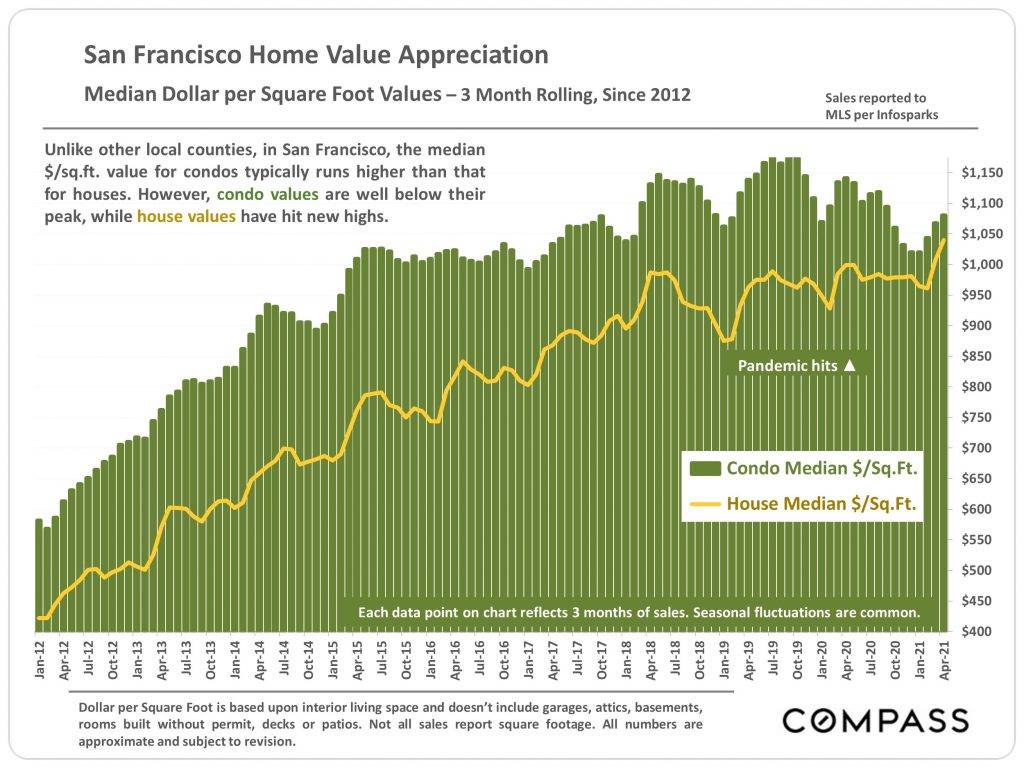
San Francisco condos have historically sold for a considerably higher price per square foot. However, the price per square foot among houses has more quickly recovered to reach new heights after the pandemic hit, thus narrowing the gap.
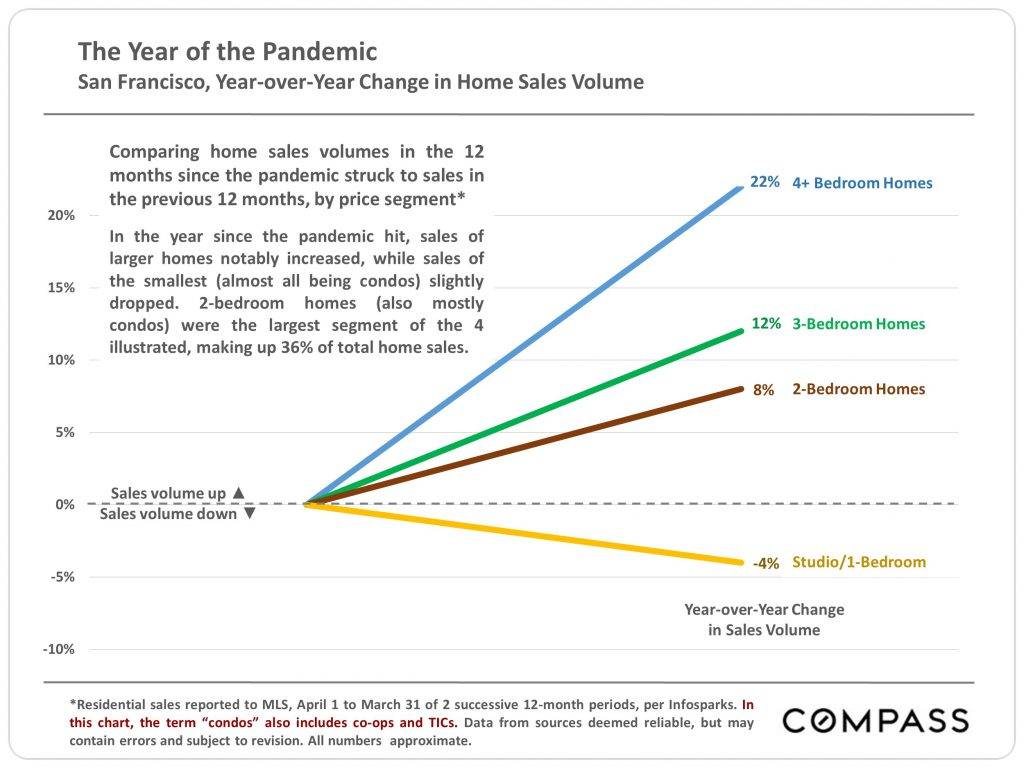
In the 12 months after the pandemic struck, home sales volumes increased (or fell) concerning their size. The more bedrooms, the greater the increase in sales volume. Studios/1-bedrooms decreased in sales volume.
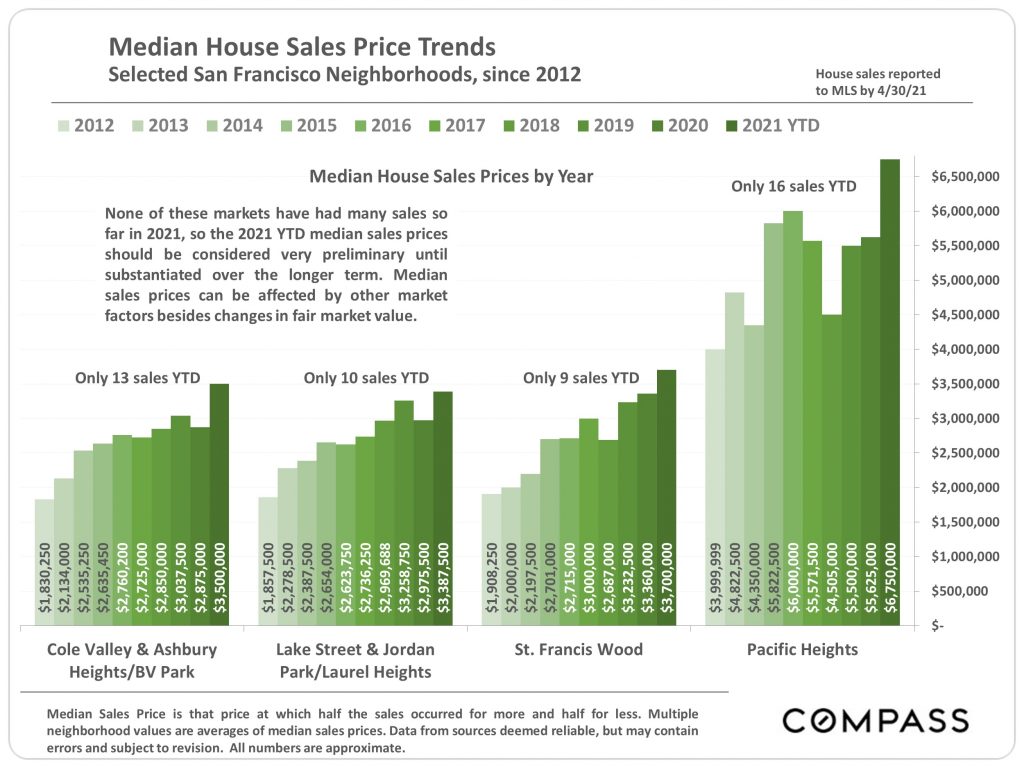
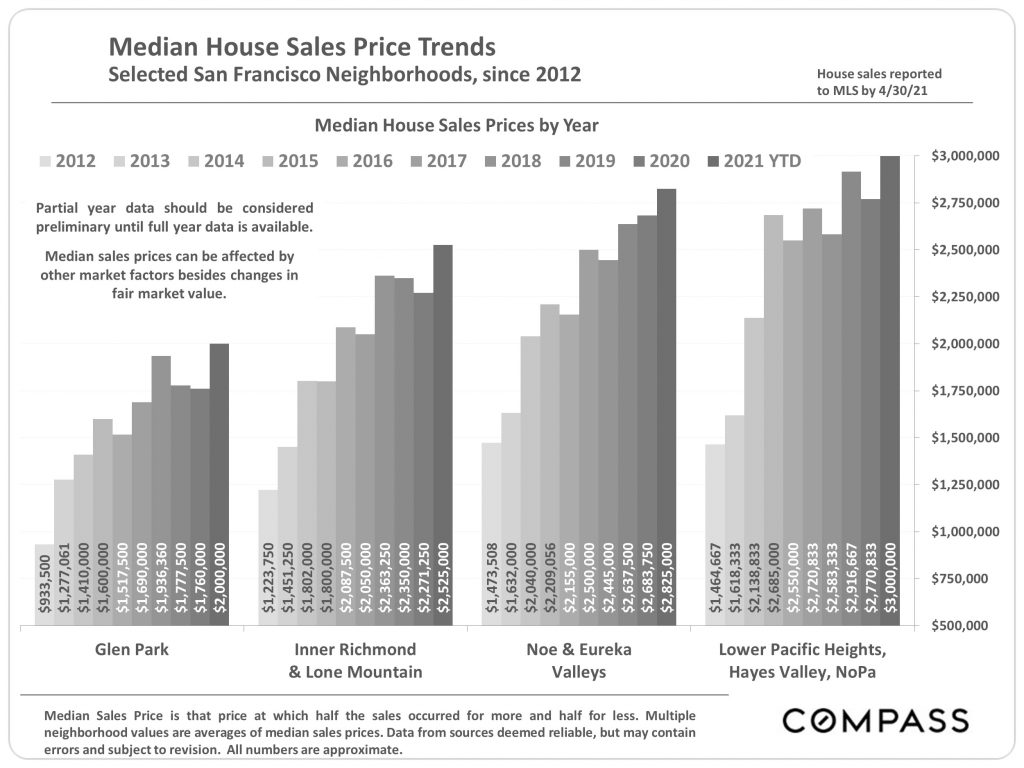
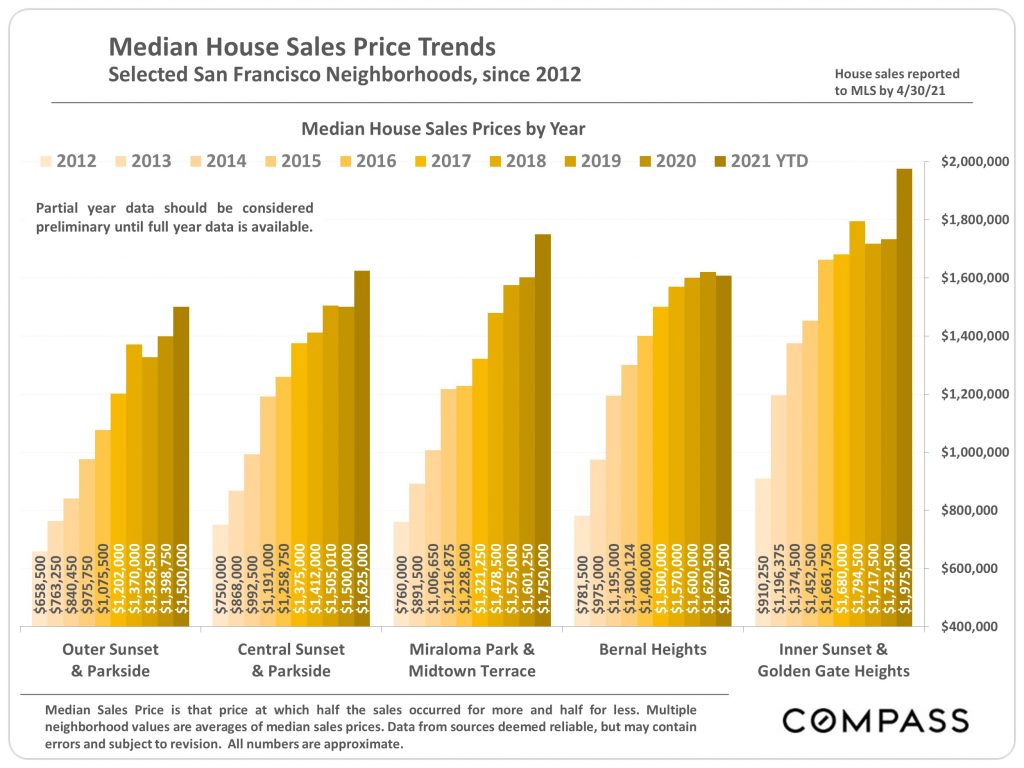
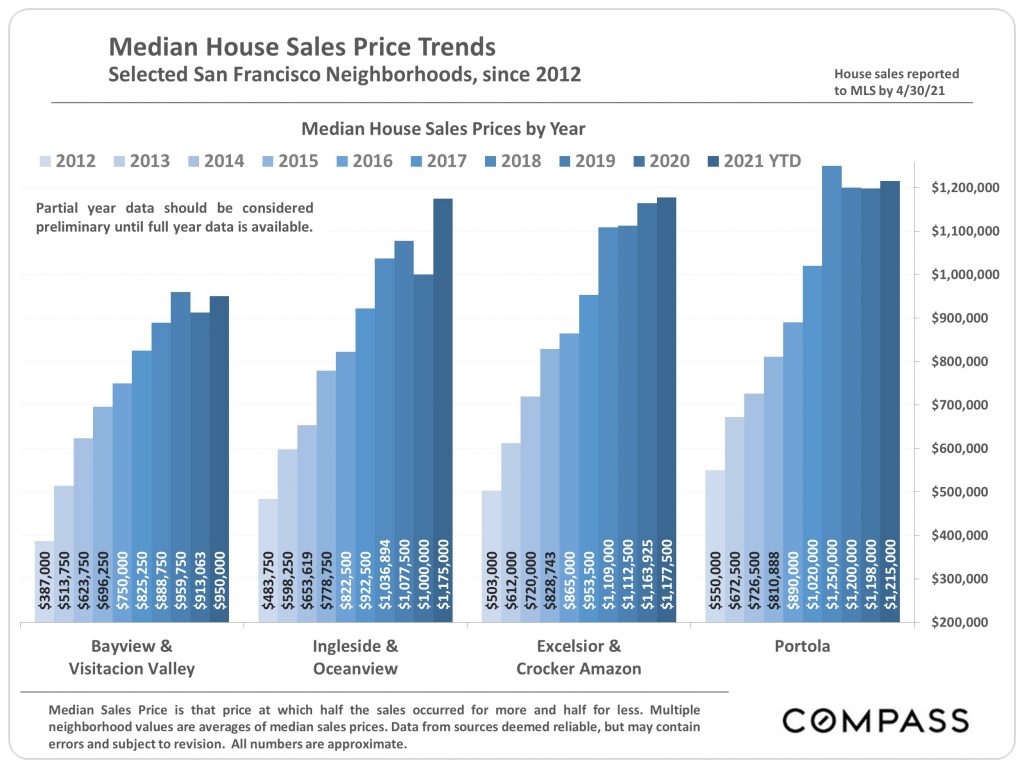
The following charts outline the trend in single-family house sales prices in various San Francisco neighborhoods from 2012 to the present.
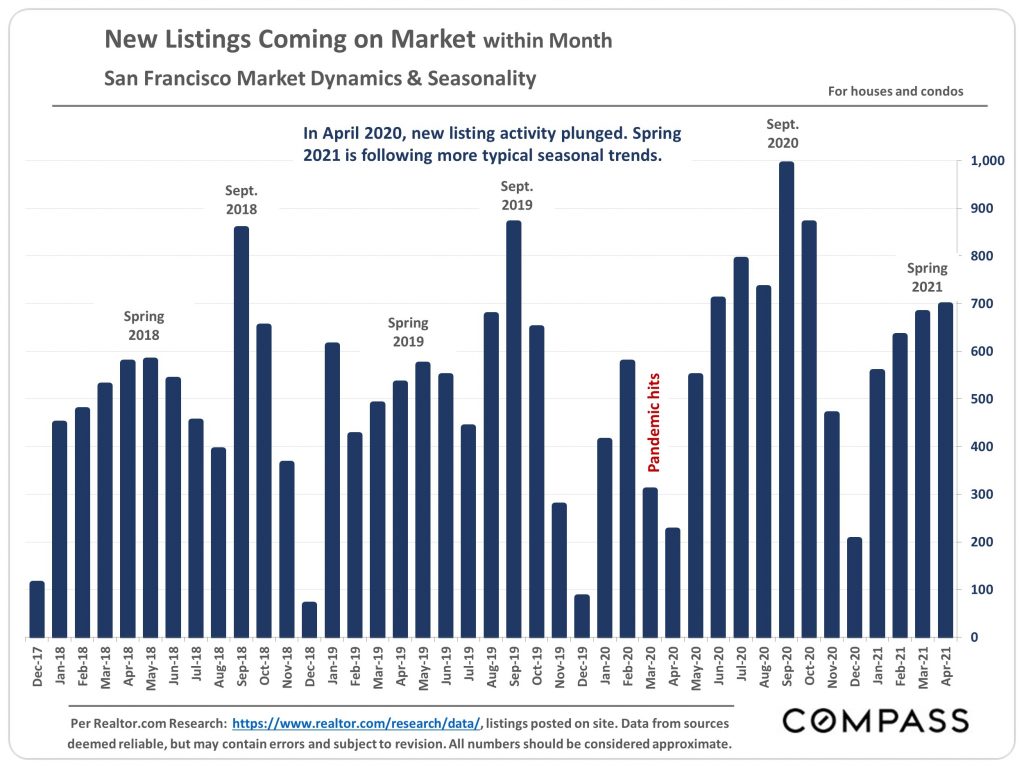
After an outlying year for the real estate market (and so much else), Spring 2021 has seen new listing activity revert to a more familiar trend pattern.
The huge spike in listing supply that grew out of the pandemic's early days has since fallen just as sharply — even among condos.
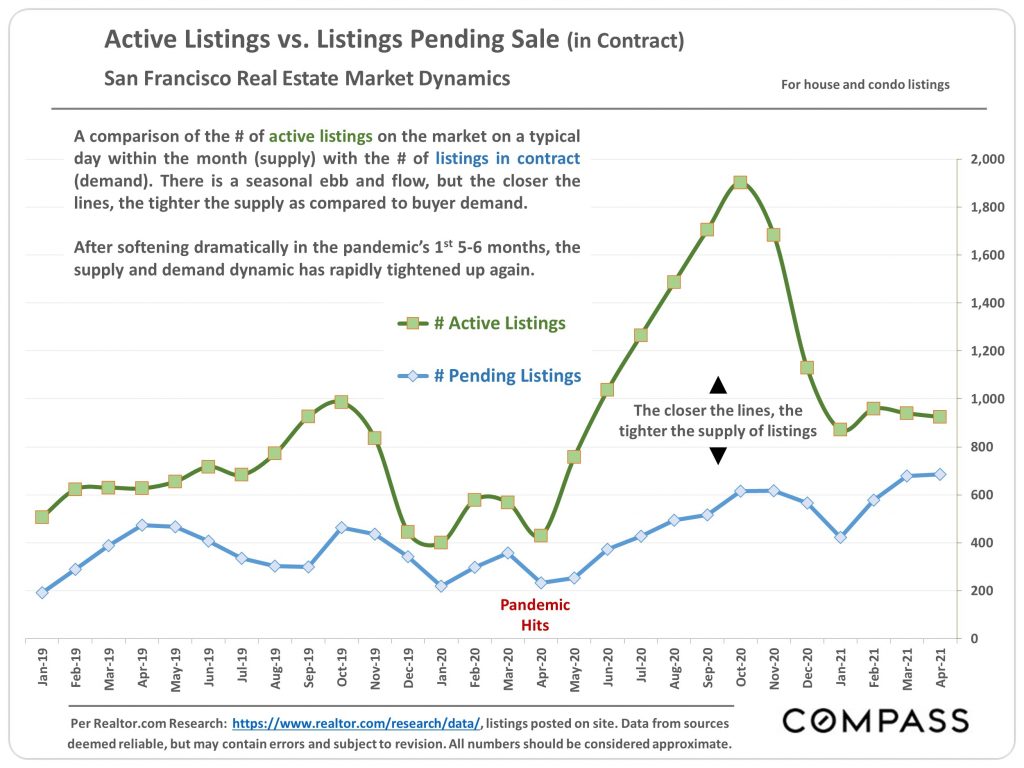
Supply and demand are tight — and getting tighter — for San Francisco real estate listings.
Price reductions among active listings shot way up as homes languished on the market in the first few months of the pandemic. They have since come back down to more or less match seasonal trends.
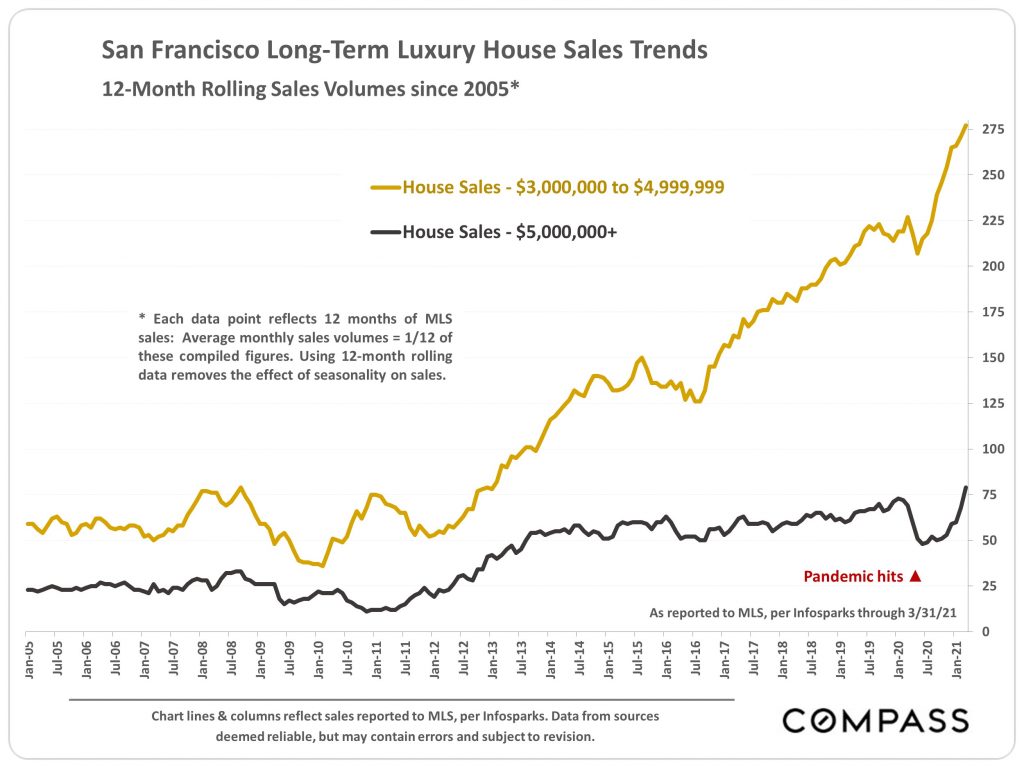
Sales of luxury single-family houses between $3–5 million rocketed up after the pandemic hit.
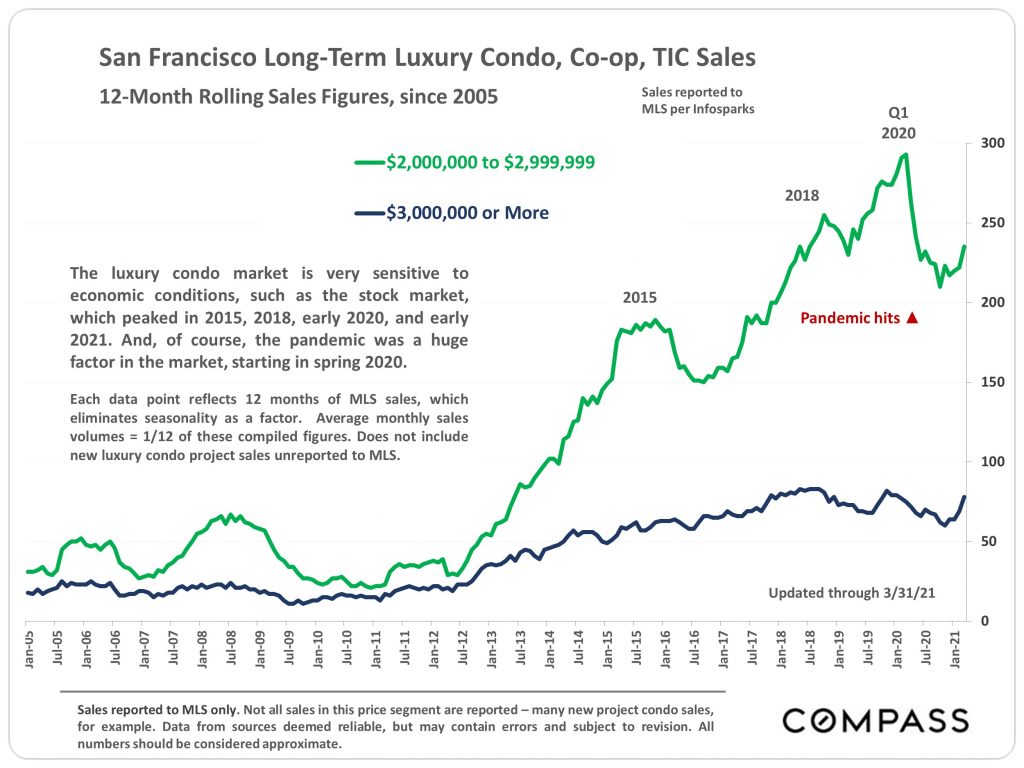
Sales of luxury condos, $2 million+, tend to follow wider economic trends. Three large, recent peaks coincide with peaks in the stock market.
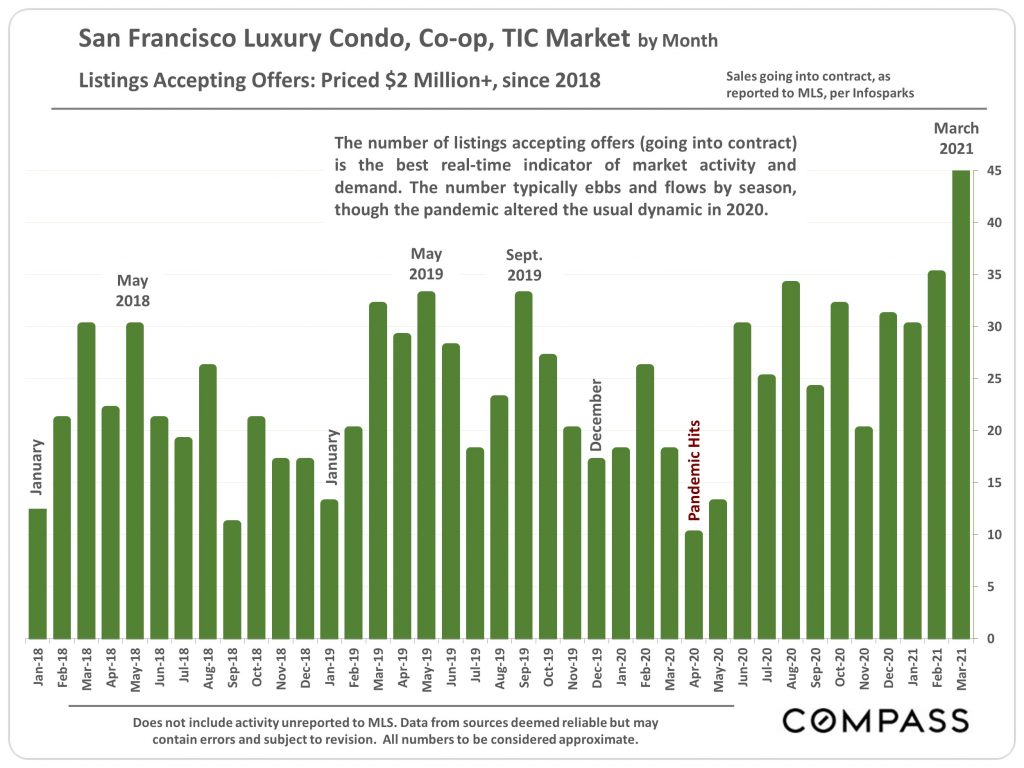
The monthly number of luxury condos, co-ops, and TICs ($2 million+) accepting offers has roared back in 2021, reaching a chart-topping high in March.
Same goes for luxury single-family houses ($3 million+) — March 2021 saw the highest number of sales in years.
Hopefully, this San Francisco real estate market data can help you in planning your real estate future.
If you have questions about the market or your next steps to buying or selling, let us know! We’re always happy to help you and anyone you send our way.
If you are thinking of selling your San Francisco property, fill out our Seller Worksheet to tell us more about your situation. If you’re looking to buy a home in San Francisco, tell us your goals and timeframe in our Buyer Worksheet. Or send us a message with any general inquiries. Have a great day!
(Footnote disclaimer: Statistics are generalities, essentially summaries of disparate data generated by dozens, hundreds or thousands of unique, individual sales. They are best seen not as precise measurements, but as broad, comparative indicators, with reasonable margins of error. Anomalous fluctuations in statistics are not uncommon, especially in smaller markets with fewer sales. Data from sources deemed reliable, but may contain errors and subject to revision. All numbers are approximate.)
